 |
VOOZH | about |
|
VOOZH | about |
Association Rule Mining is an unsupervised learning technique used to discover interesting relationships, patterns, or associations between items in large transactional datasets. It helps answer questions like, “What products are frequently bought together?” This technique is widely used in market basket analysis, recommendation systems, and customer behavior prediction.
To evaluate and rank the strength of discovered rules, three key metrics are used:
Support: Support tells how frequently an item or a set of items appears in the dataset.
Formula:
Confidence: Confidence tells how likely item Y is purchased when item X is purchased.
Formula:
Lift: Lift tells how likely item Y is purchased with X compared to the regular purchase rate of Y. A lift > 1 means X and Y are positively related.
Formula:
Example: A customer does 4 transactions with you. In the first transaction, she buys 1 apple, 1 beer, 1 rice, and 1 chicken. In the second transaction, she buys 1 apple, 1 beer, 1 rice. In the third transaction, she buys 1 apple, 1 beer only. In fourth transactions, she buys 1 apple and 1 orange.
Support(Apple) = 4/4
So, Support of {Apple} is 4 out of 4 or 100%
Confidence(Apple -> Beer) = Support(Apple, Beer)/Support(Apple)
= (3/4)/(4/4)
= 3/4
So, Confidence of {Apple -> Beer} is 3 out of 4 or 75%
Lift(Beer -> Rice) = Support(Beer, Rice)/(Support(Beer) * Support(Rice))
= (2/4)/(3/4) * (2/4)
= 1.33
So, Lift value is greater than 1 implies Rice is likely to be bought if Beer is bought.
We are performing market basket analysis using the Apriori algorithm on a groceries dataset, where each transaction is grouped by Member_number and items are listed in the itemDescription column.
We install the necessary libraries for rule mining and visualization.
arules using plots and graphs.We load the required libraries into the session to make their functions available.
We read the CSV file containing the transactions into R as a data frame.
You can download the dataset from here.
We group items by customer ID to create transactions.
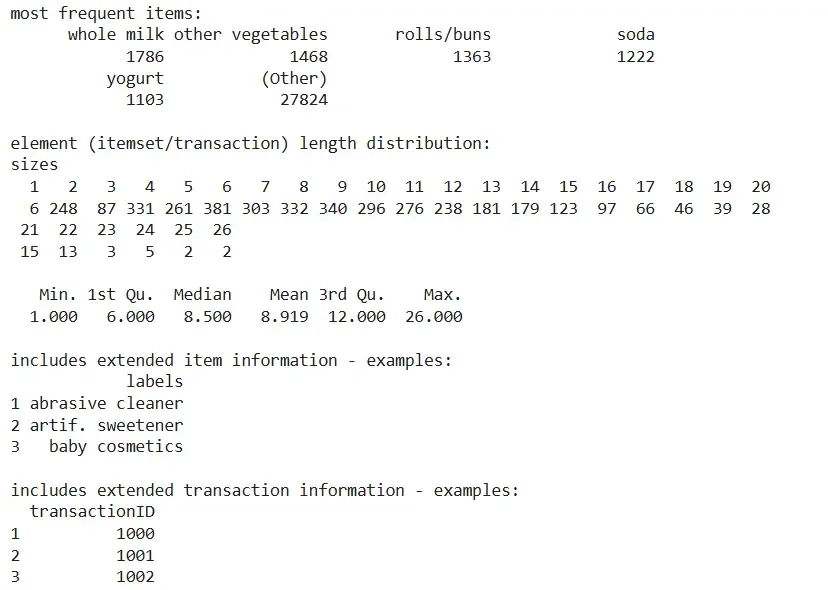
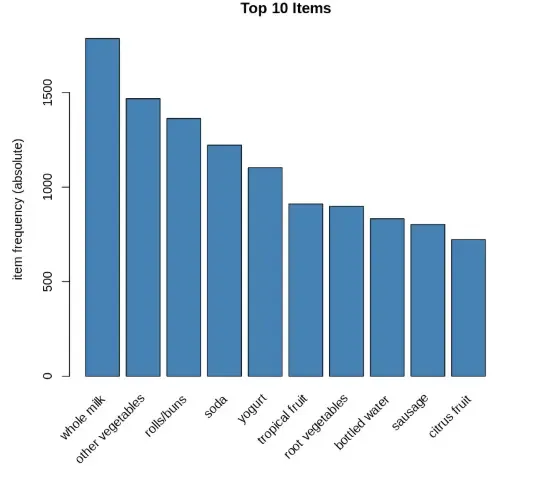
We visualize the top items purchased across all transactions.
Output:
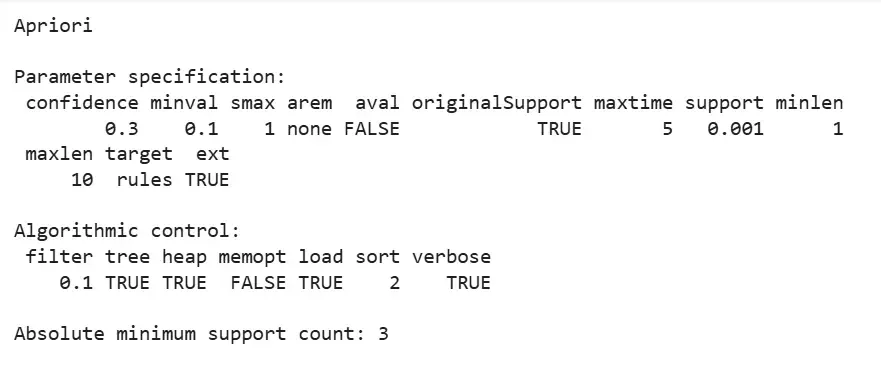
We generate association rules from the transaction data.
Output:
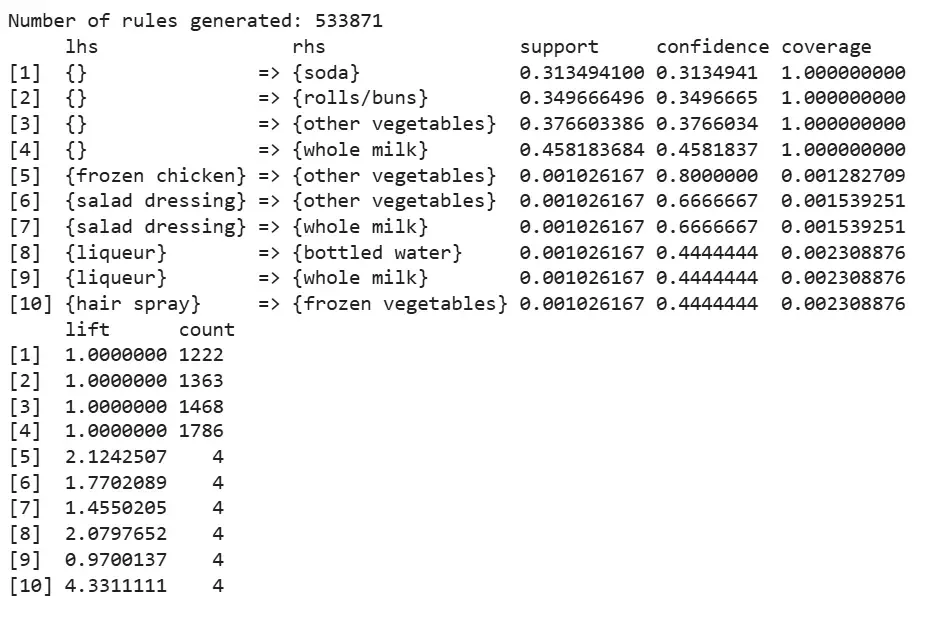
We print the number of rules generated and inspect a few.
Output:
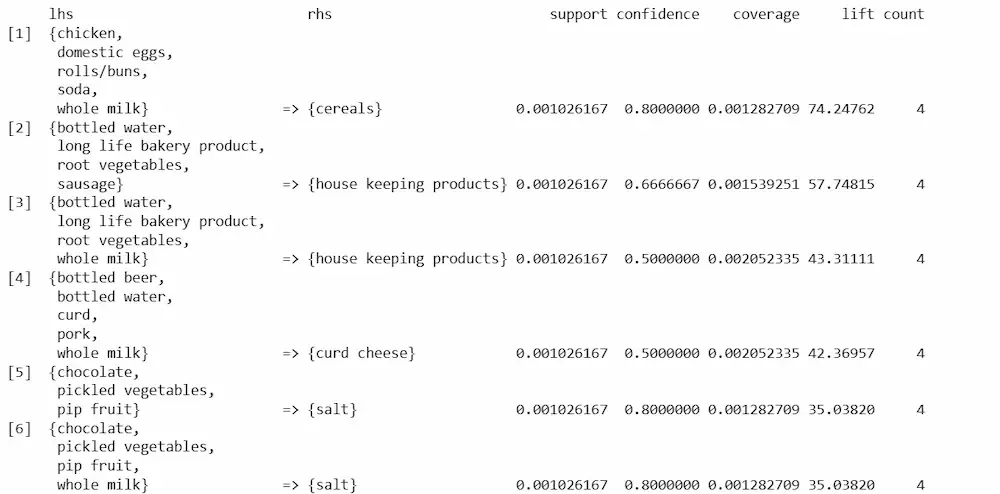
We sort rules to identify those with the highest lift.
Output:
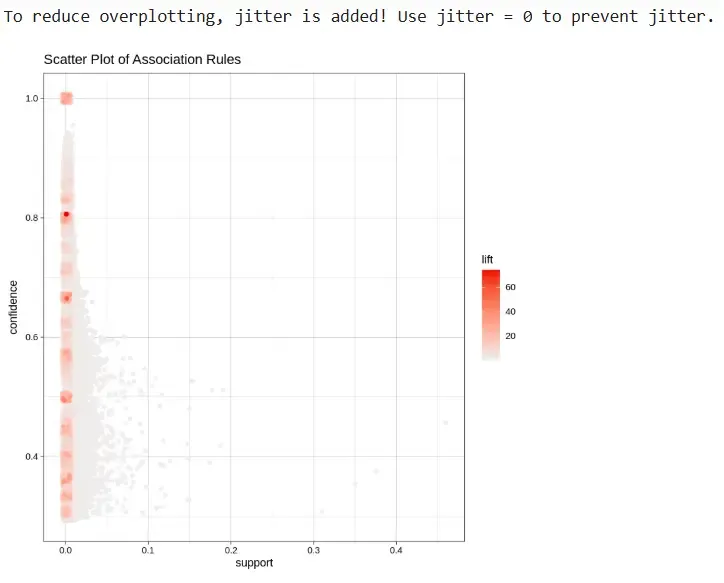
We visualize the rules by support and confidence.
Output: