 |
VOOZH | about |
|
VOOZH | about |
The colorspace package in R provides a robust toolkit for handling and manipulating colors in the R Programming Language. It offers various functions and utilities for color manipulation, conversion, visualization, and palettes, making it an essential tool for data visualization and graphical representations. This guide will introduce the Colorspace package and demonstrate its key functionalities with practical examples.
To get started with the colorspace package, you need to install and load it into your R session. Use the following commands to install and load the package:
install.packages("colorspace")
library(colorspace)
The colorspace package provides various functionalities, including:
One of the core features of the colorspace package is the ability to convert colors between different color spaces. The supported color spaces include RGB, HSV, HCL, and more.
Output:
 L C H
[1,] 32.29567 130.6759 265.8728
This code converts an RGB color to the HCL (Hue-Chroma-Luminance) color space.
By following these steps, you can convert any RGB color to its HCL representation using R and the colorspace package. This example demonstrates the process for the color blue, but you can easily adapt it to other colors by changing the RGB values.
The colorspace package provides several functions to create and manipulate color palettes. These palettes can be used in various data visualizations to improve the clarity and aesthetics of the plots.
Output:
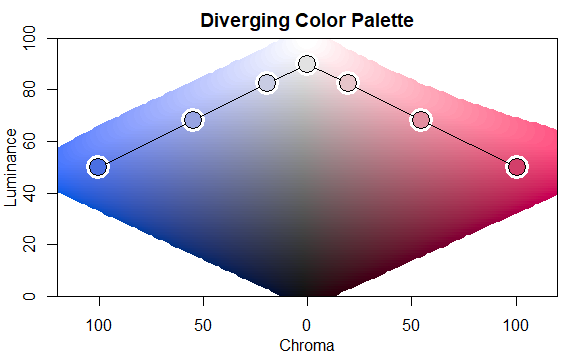
[1] "#4A6FE3" "#97A3E2" "#C8CCE3" "#E2E2E2" "#E6C5CA" "#E38EA0" "#D33F6A"This code creates a diverging color palette with 7 colors, transitioning from a hue of 260 (blue) to 0 (red).
#4A6FE3: Medium blue.#97A3E2: Light periwinkle blue.#C8CCE3: Pale blue-gray.#E2E2E2: Very light gray.#E6C5CA: Soft pinkish-gray.#E38EA0: Medium-light pink.#D33F6A: Deep pinkish-red.These colors range from shades of blue to various shades of pink and gray. Each hex color code precisely defines the color by its red, green, and blue components, allowing for consistent and exact color representation in digital design and programming.
Visualizing color palettes helps in selecting the right palette for your data visualization needs. The colorspace package provides convenient functions for this purpose.
Output:
This code visualizes the diverging color palette created in the previous example.
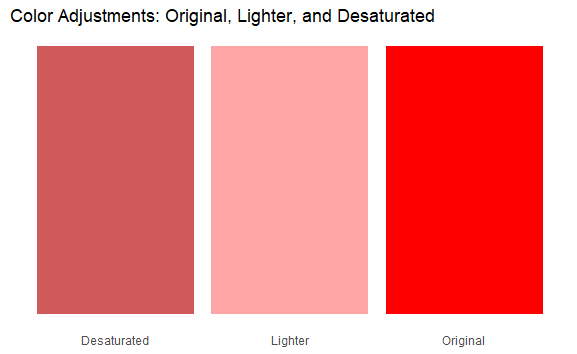
The package also includes functions for adjusting the properties of colors, such as lightness and saturation. This can be useful for fine-tuning colors to match the desired aesthetics.
Output:
We load colorspace for color adjustments and ggplot2 for visualization.
lighten() and desaturate().colors_df is created to store the colors for plotting.ggplot2 to create a bar plot where each bar represents a different color (original, lighter, and desaturated). The scale_fill_identity() function is used to map the hex colors directly to the fill aesthetic.Now you will see a bar plot with three bars:
This visualization helps to compare the effects of lightening and desaturation on the original color.
The colorspace package in R is a comprehensive toolkit for color manipulation, offering functionalities for:
By leveraging the capabilities of the colorspace package, you can significantly improve the quality and effectiveness of your visualizations, making your data presentations more impactful and aesthetically pleasing.