 |
VOOZH | about |
|
VOOZH | about |
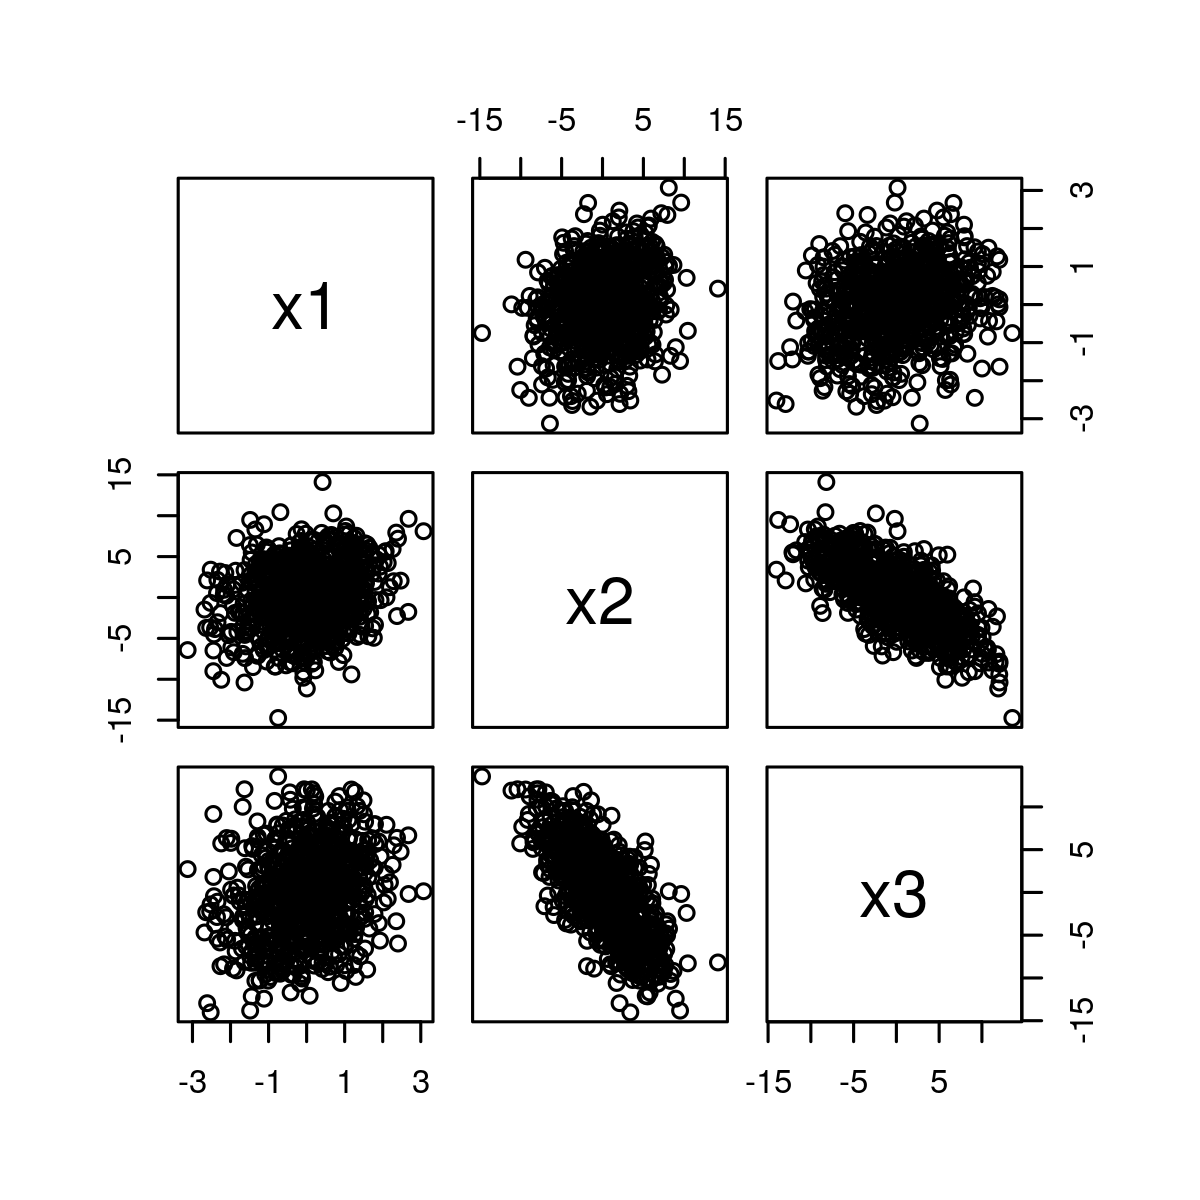
pairs() function in R language is used to return a plot matrix, consisting of scatter plots corresponding to each data frame.
Syntax: pairs(data)
Parameters:
- data: It is defined as value of pairs Plot.
Returns: Color, Labels, Panels, and by Group in pairs plot.
Output:
👁 ImageHere, in the above example, the diagonal shows the names of the three numeric variables. The middle graphic in the first-row shows the relation between x1 and x2 whereas the right graph in the first row shows the relation between x1 and x3 and so on.
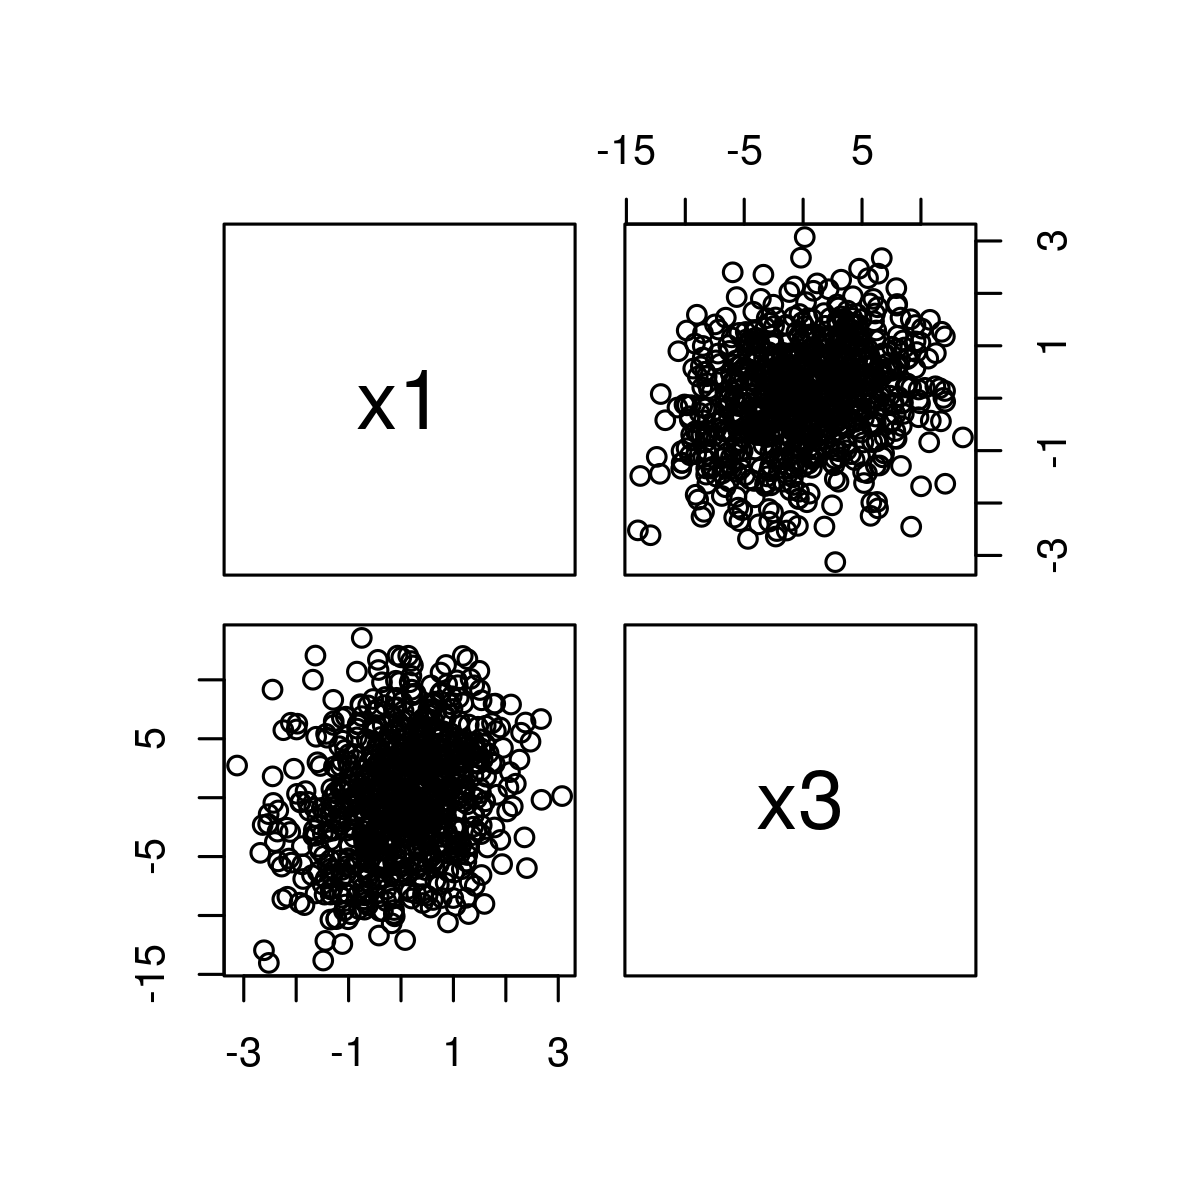
Output:
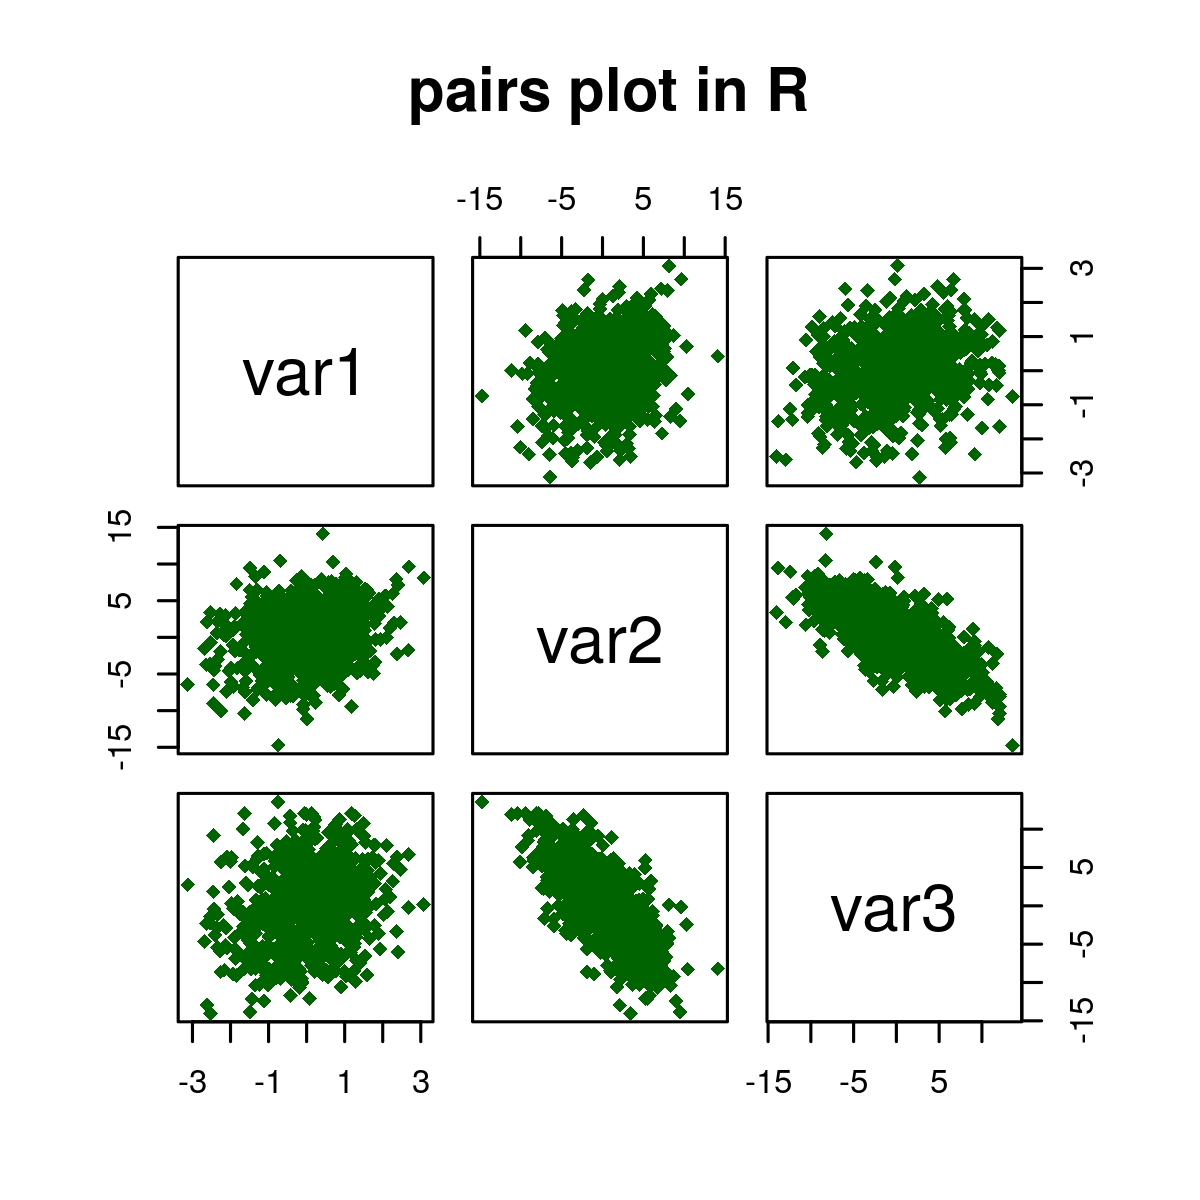
👁 ImageOutput:
👁 Image