 |
VOOZH | about |
|
VOOZH | about |
R Programming Language is an open-source language, that has extensive applications for statistical and data analysis. For proposing useful information and making essential decisions about any available data, data visualization presents itself as an effective graphical technique. Graphs, maps, and charts are considered major elements for data visualization and data analysis.
R has an extensive range of packages and libraries which are used for data visualization. DiagrammeR is a package in R language that is used for data visualization by creating multiple data elements such as graphs, flowcharts, network diagrams, and decision trees. Additionally, because of its flexible framework, DiagrammeR can facilitate the customization and modification of generated diagrams as well.
DiagrammeR package is capable of generating, modifying, analyzing, and visualizing the network graph diagrams. Network graph diagrams as output from the DiagrammeR can be extracted in the form of documents, integrated into the website applications, and exported into images as well as PDF formats. Easy creation and modification of network diagrams, visualization of it and later obtaining in multiple formats are the key features which makes DiagrammeR an effective package.
In order to install and load DiagrammeR, there are following steps:
DiagrammeR can also be installed in an environment of R where it can be obtained from Comprehensive R Archive Network (CRAN). To install DiagrammeR package from CRAN, install.packages(“DiagrammeR”) command is used as discussed above.
After the successful installation of the package, its library can be loaded by using library(DiagrammeR) command.
DiagrammeR is able to create the diagrams such as flow charts and network diagrams. Additionally, the package also provides the flexibility of incorporating different attributes such as colors and dimensions along with the flow charts and network graph diagrams. These are classified into nodes and edges which provides capability to create flow chart or network graph. In the end as a result, diagram can be saved into different formats such as pdf. Creation and export of graph is majorly comprised of three steps and as follow:
Diagram is constituted of nodes and edges where nodes describe the data elements and edges represent the connections between the nodes. create_node_df() and create_edge_df() are the command of R which are used for the creation of nodes and edges respectively.
After defining nodes and edges of a diagram, create_graph() creates graph which can be visualized from render_gragh(). The generalized code for creating the graph is:
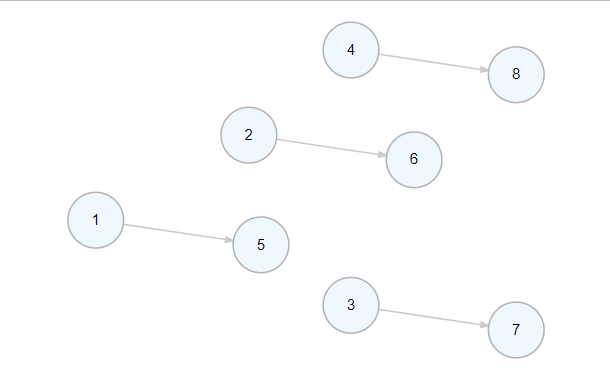
An example for the creation of graph from DiagrammeR is:
Output:
Diagram as PDF
DiagrammeR has an ability to save the generated graphs and diagrams into different formats for data visualization. There are many formats such as PNG, PDF, SVG, and PostScript in which the created diagrams and graphs can be exported. Among them, diagrams and graphs can be exported in PDF format by using DiagrammeR. For this purpose, export_graph() is used. Diagrams from export_graph() as PDF can be exported. However, for this purpose packages of DiagrammeRsvg and rsvp must be installed.
General code for exporting the diagram in a specific format is:
It is important to note that the same command can be used in order to export the diagrams into other formats as well. In the continuation of previous example, the graph can be exported in PDF as:
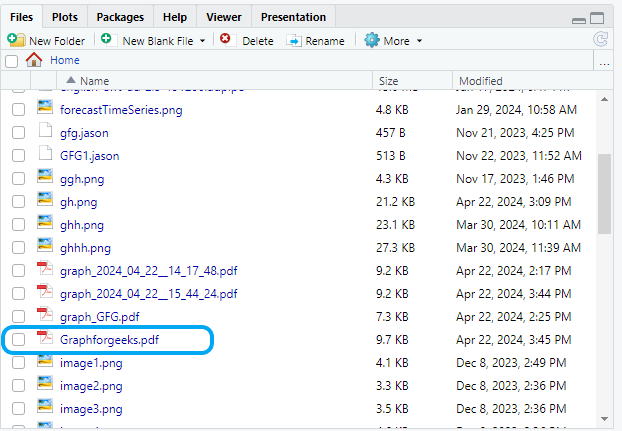
Output:
You can see this saved file in console part of the R Environment. This command will save the diagram in the directed repository with name “Graphforgeeks” in PDF format. It is important to note that if file_type will be separately used and defined then file will be saved with "File" type which can be opened in PDF. However, introducing "Graph_Name.pdf" will save it in PDF format as represented in the code.
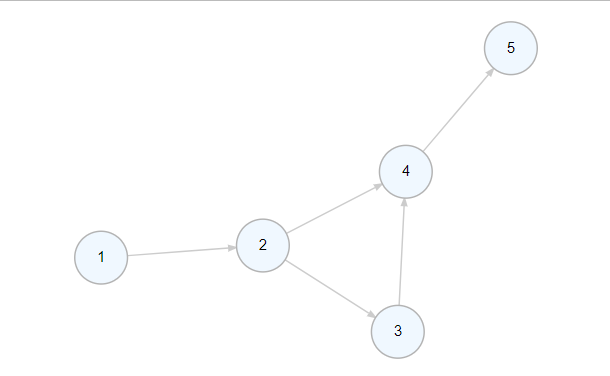
There are many types of diagrams which can be created from DiagrammeR. Here is another example which can provide a flowchart and network diagram with short R syntax for creation of graph as well as export as PDF.
Output:
DiagrammeR is a useful package which has been introduced in R for creating different type of graphs and diagrams. Additionally, this package helps in exporting the generated diagrams and graphs into different formats by providing simple commands in R. These diagrams can also be exported in PDF format into the defined directory of R studio.