 |
VOOZH | about |
|
VOOZH | about |
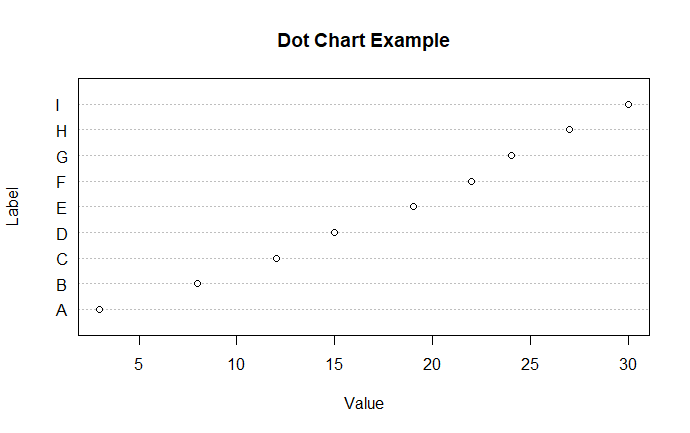
dotchart() function in R Language is used to create a dot chart of the specified data. A dot chart is defined as a plot which is used to draw a Cleveland dot plot.
Syntax: dotchart(x, labels = NULL, groups = NULL, gcolor = par("fg"), color = par("fg")) Parameters: x: it is defined as numeric vector or matrix labels: a vector of labels for each point. groups: a grouping variable indicating how the elements of x are grouped. gcolor: color to be used for group labels and values. color: the color(s) to be used for points and labels.
Example 1:
Output: 👁 Image
Example 2:
Output: 👁 Image
Example :
output :