Cumulative frequency and probability tables help summarize data distributions. They show how data values accumulate over time or categories and allow us to calculate probabilities from frequency distributions.
Functions Used
Table(): Used to create a frequency table by counting occurrences of each unique value in a vector.
frequency_table <- table (vec)
Parameter:
vec: A vector or factor containing the data to be counted.
Cumsum():Computes cumulative frequency by summing the frequencies progressively across the table.
cumsum ( frequency_table)
Parameter:
frequency_table: A table of frequencies generated from the table() function.
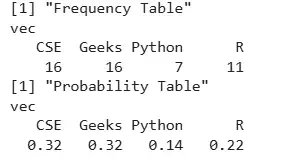
prop.table: Converts the frequency table into a probability table by dividing each frequency by the total count.
prop.table(frequency_table)
Parameter:
frequency_table: A table of frequencies generated from the table() function.
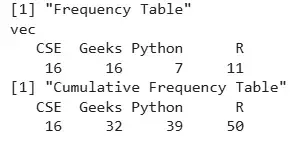
Example 1: We are creating a frequency table and a cumulative frequency table from a sample of categorical values.
set.seed: Ensures the random sample is reproducible.
vec: A character vector containing randomly sampled values.
sample: Randomly selects elements from a specified set.
table: Generates a frequency table of unique values in the vector.
data: Stores the frequency table created from vec.
print: Displays the output to the console.
cumsum: Calculates the cumulative frequency from the frequency table.
cumfreq_data: Stores the cumulative frequency result.
