 |
VOOZH | about |
|
VOOZH | about |
Data manipulation in R involves cleaning, transforming, and organizing data to make it suitable for analysis. It includes tasks like selecting, filtering, sorting, and creating new variables, often done using the dplyr package for simple and efficient operations. The dplyr package provides functions to perform these operations using simple syntax.
Some of the key functions in the dplyr package used for manipulating data in R are:
Function Name | Description |
|---|---|
filter() | Produces a subset of a Data Frame. |
distinct() | Removes duplicate rows in a Data Frame |
arrange() | Reorder the rows of a Data Frame |
select() | Produces data in required columns of a Data Frame |
rename() | Renames the variable names |
mutate() | Creates new variables without dropping old ones. |
transmute() | Creates new variables by dropping the old. |
summarize() | Gives summarized data like Average, Sum, etc. |
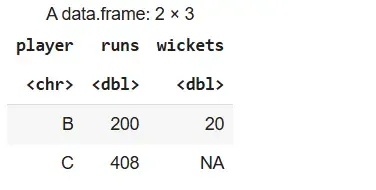
We use the filter() method to extract rows that meet a given condition.
Syntax:
filter(dataframeName, condition)
Example:
We will create a sample data frame from which we extract rows where the runs column is greater than 100.
runs > 100.Output:
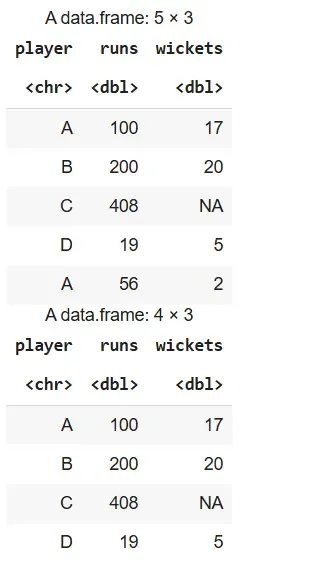
We use the distinct() method to remove duplicate rows based on one or more columns.
Syntax:
distinct(dataframeName, col1, col2,.., .keep_all=TRUE)
Example:
We remove duplicate rows from the stats data frame, first entirely and then based on the player column.
Output:
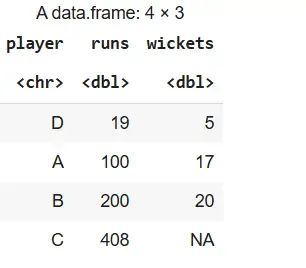
We use the arrange() method to sort rows in ascending order based on one or more columns.
Syntax:
arrange(dataframeName, columnName)
Example:
We sort the rows of the stats data frame based on the runs column in ascending order.
Output:
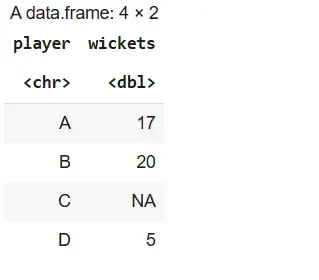
We use the select() method to extract specific columns from a data frame.
Syntax:
select(dataframeName, col1,col2,...)
Example:
We select only the player and wickets columns from the stats data frame.
Output:
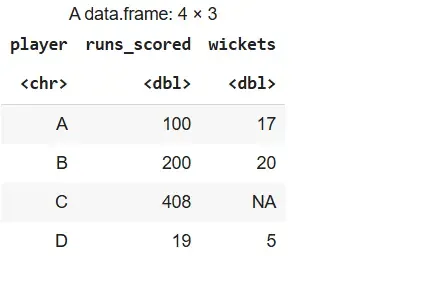
We use the rename() method to change the names of columns in a data frame.
Syntax:
rename(dataframeName, newName=oldName)
Example:
We rename the runs column to runs_scored in the stats data frame.
Output:
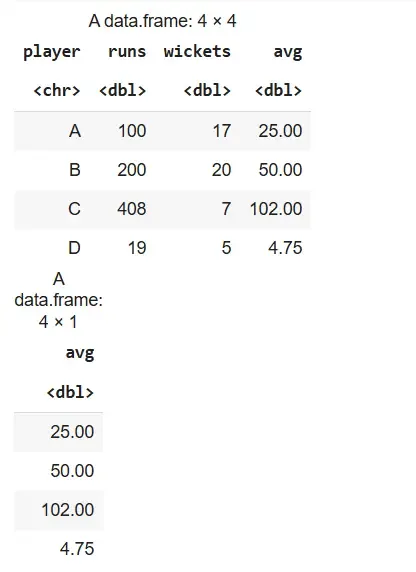
We use mutate() to create new columns while keeping the existing ones.
Syntax:
mutate(dataframeName, newVariable=formula)
transmute(dataframeName, newVariable=formula)
Example:
We add a new column avg as runs divided by 4 using both mutate() and transmute().
Output:
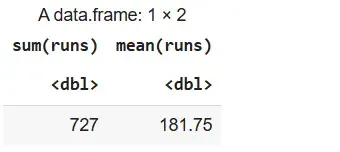
We use the summarize() method to reduce a set of values to a single summary value using aggregation functions like sum(), mean(), etc.
Syntax:
summarize(dataframeName, aggregate_function(columnName))
Example:
We summarize the runs column to get its total and average.
Output: