 |
VOOZH | about |
|
VOOZH | about |
legend() function in R Programming Language is used to add legends to an existing Plot. A legend is defined as an area of the graph plot describing each of the parts of the plot. The legend plot is used to show statistical data in graphical form.
Syntax: legend(x, y, legend, fill, col, bg, lty, cex, title, text.font, bg)
Parameters:
- x and y: These are co-ordinates to be used to position the legend
- legend: Text of the legend
- fill: Colors to use for filling the boxes of legend text
- col: Colors of lines
- bg: It defines background color for the legend box.
- title: Legend title (optional)
- text.font: An integer specifying the font style of the legend (optional)
- Returns: Legend plot
Output:
Output:
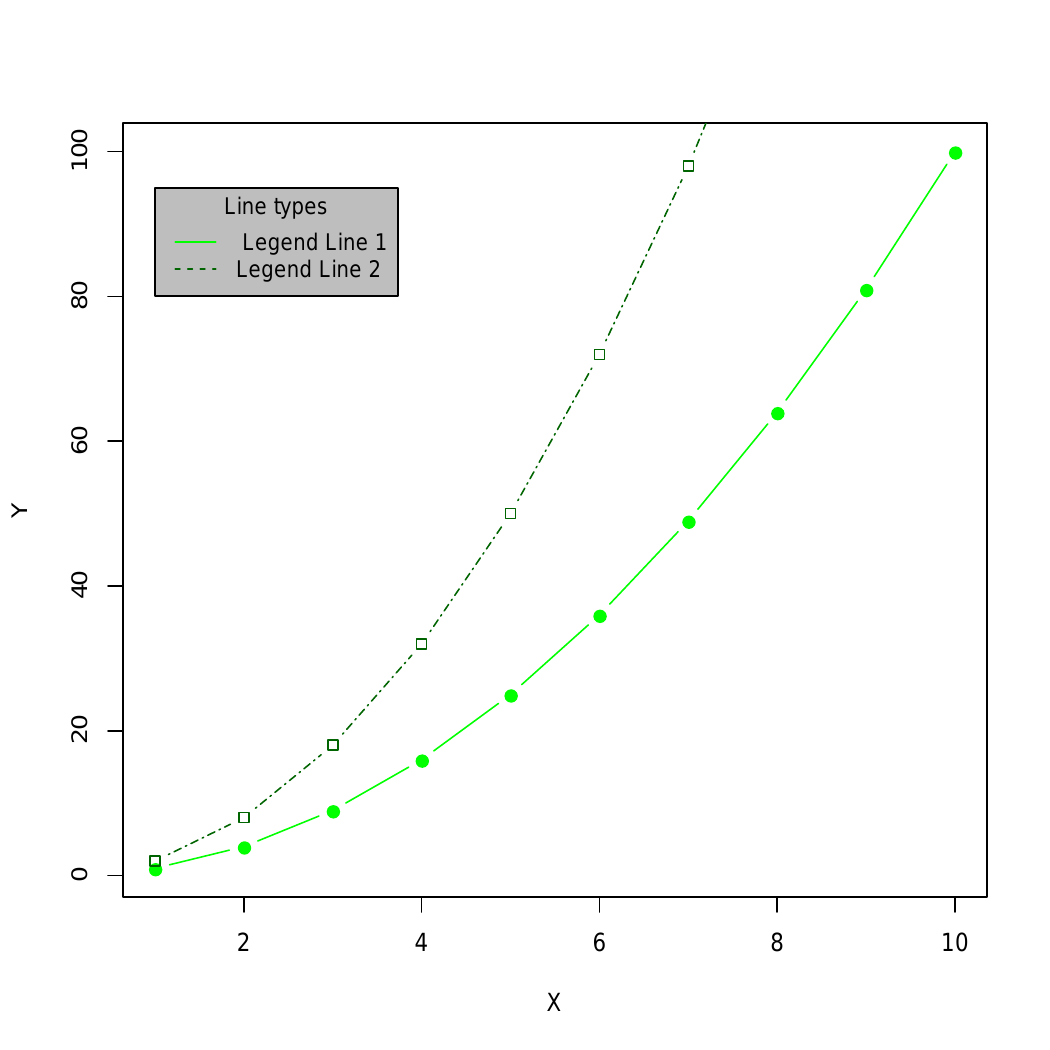
👁 ImageHere, the legend() function is used to add a legend to the plot, and makePlot() function is used to manipulate font, background color.
Syntax: legendx, y, fill, col, bg, lty, cex=0.8, box.lty, box.lwd, box.col)
Parameters:
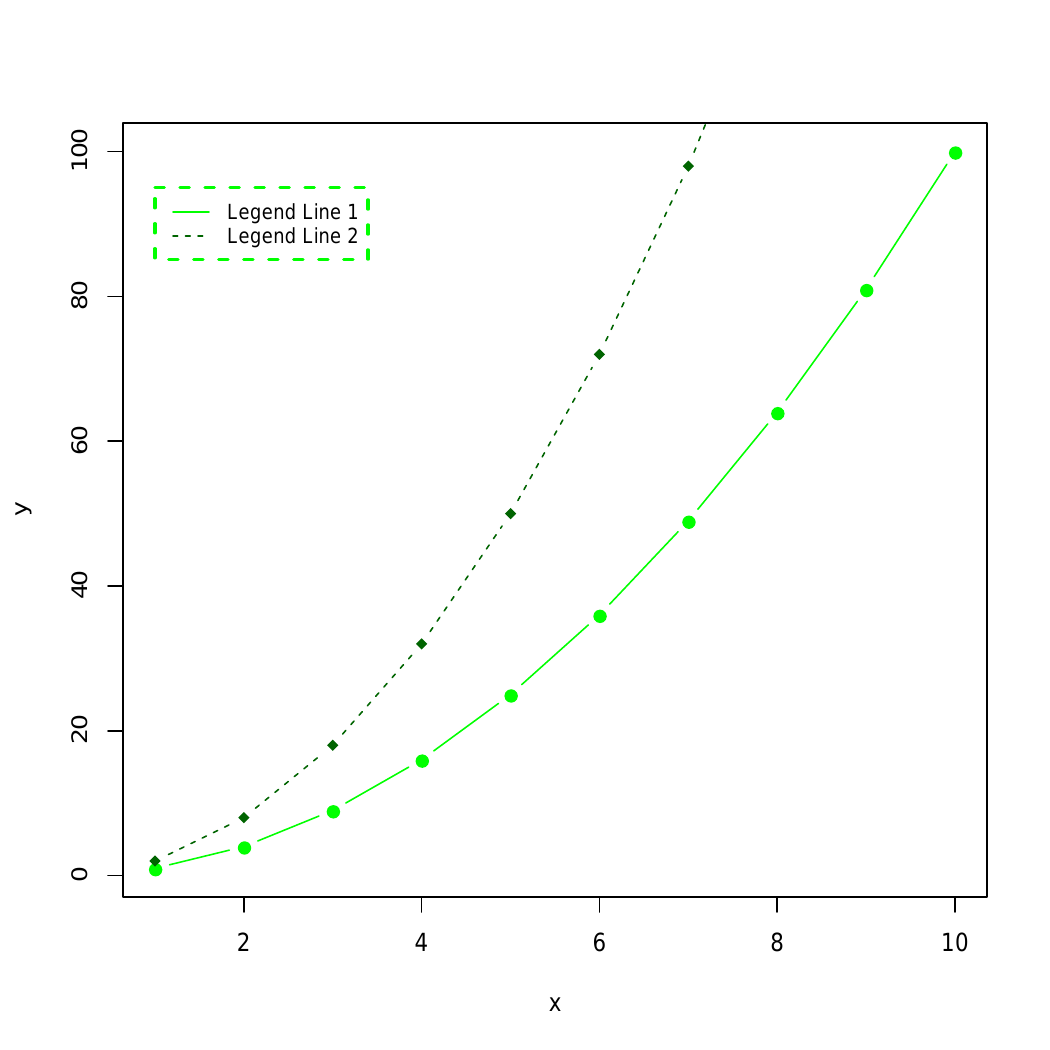
box.lty, box.lwd and box.col: line type, width and color for the legend box border, respectively.
Output:
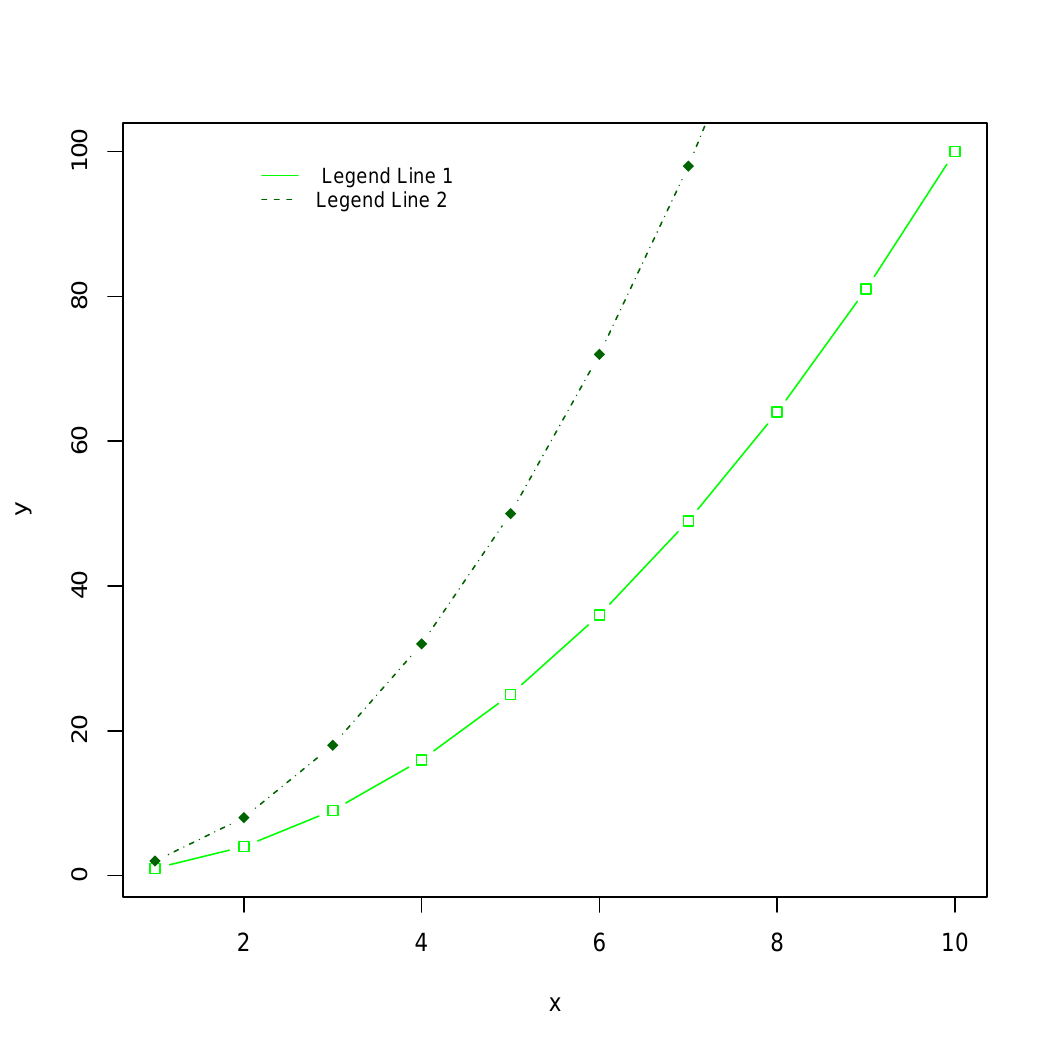
👁 ImageSyntax: legendx, y, fill, col, bg, lty, cex=0.8, box.lty=0)
Parameter:box.lty: Box line width
Output:
👁 ImageIn example 3 and example 4 box.lty, box.lwd, and box.col can be used to modify the line type, width, and color for the legend box border, respectively are used to modify the arguments.
Output:
makePlot() function to create a plot with two lines. Subsequently, a horizontal legend is added at the bottom of the plot using the legend() function. The legend includes labels "Line 1" and "Line 2," corresponding colors, line types, and different symbols (plotting characters) for each line. The horiz = TRUE argument ensures a horizontal layout for the legend.