 |
VOOZH | about |
|
VOOZH | about |
The Dirichlet distribution is a multivariate generalization of the Beta distribution and is commonly used in Bayesian statistics, machine learning, and other fields where probability distributions over multiple categories are required. This article provides an in-depth understanding of the Dirichlet distribution, how to use it in R, and various practical applications using R Programming Language.
The Dirichlet distribution is a family of continuous multivariate probability distributions parameterized by a vector of positive real numbers. It is widely used when dealing with proportions or probabilities that sum up to 1, such as the distribution over categories in topic modeling, genetics, and Bayesian modeling.
You need the MCMCpack package to work with the Dirichlet distribution in R. Install it using:
install.packages("MCMCpack")
library(MCMCpack)
We can use the rdirichlet function from the MCMCpack package to generate random samples.
Output:
 [,1] [,2] [,3]
[1,] 0.19394802 0.4718276 0.3342244
[2,] 0.58236174 0.1314433 0.2861949
[3,] 0.07222701 0.1258402 0.8019328
[4,] 0.38156708 0.1275617 0.4908712
[5,] 0.34574573 0.1237161 0.5305382
In this example, each row represents a sample from the Dirichlet distribution with proportions summing to 1.
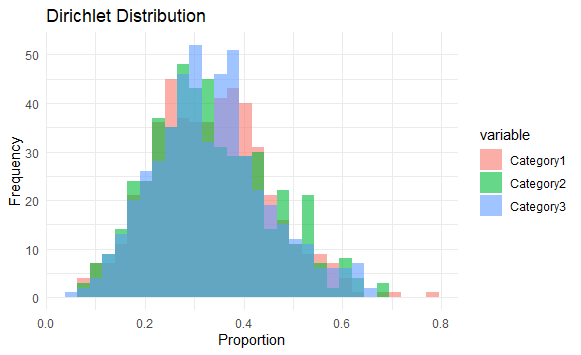
Visualizing the Dirichlet distribution helps in understanding how different alpha parameters affect the distribution of probabilities.
Output:
This example visualizes how the Dirichlet distribution is spread over three categories with the given alpha parameters.
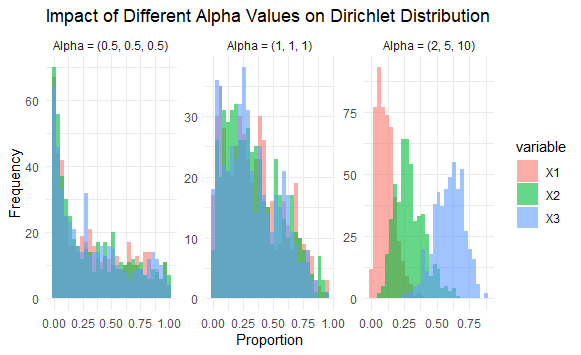
The values in the alpha vector (α1,α2,…,αK) affect the shape of the Dirichlet distribution:
Lets see the Impact of Different Alpha Values:
Output:
The Dirichlet distribution is a powerful tool when dealing with categorical data and proportions. Its flexibility and ability to model multiple categories make it invaluable in many fields, especially Bayesian statistics and machine learning. The MCMCpack package in R provides a straightforward way to generate and work with Dirichlet-distributed data. By understanding and visualizing the Dirichlet distribution, you can gain insights into how different parameters affect the distribution of probabilities, making it easier to apply in real-world scenarios.