 |
VOOZH | about |
|
VOOZH | about |
Visualizing data can help gather insights from it that descriptive statistics can't. Anscombe's Quartet shows us how those statistics could be misleading, hence it becomes to analyze the data visually. Histograms are a way to visualize the data distribution of a continuous variable. Histograms are similar to bar plots, but bar plots visualize categorical data and histograms visualize continuous data. In this article, we'll see how we can create histograms in R Programming Language and how to add mean and median lines to them.
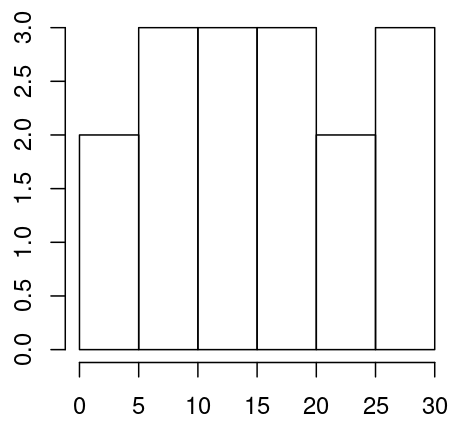
Before learning the code to create histograms, let's go ahead and understand how to make them. The process to create a histogram is simple, you start by deciding a bin size let's take the bin size as 5 for now. Next, we'll find the frequency of the no. that lie in the bins(0-5, 5-10,10-15,..). So if we have sample data as [2, 3, 7, 8, 10, 13, 14, 15, 17, 18, 20, 22, 25, 26, 27, 28] and bin size as 5 then we'll get the following histogram:-
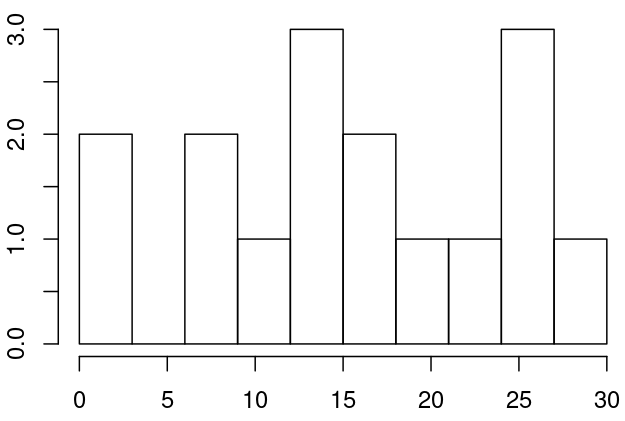
👁 ImageLet's understand the above plot. In our sample data, we have 2 values in the range 0-5 hence the bar for 0-5 is of the height 2 units on the y axis. Similarly, we have 3 values in the range 5-10 hence the height of that bar is 3. Histogram change with change in bin size. The same data of bin size 3 will give the following histogram:-
👁 ImageSo it's important to set the correct bin size in order to get valuable insights from the data. There are many formulas to find correct bin size like Sturge's Rule, Rice Rule, Scott's Rule, etc.
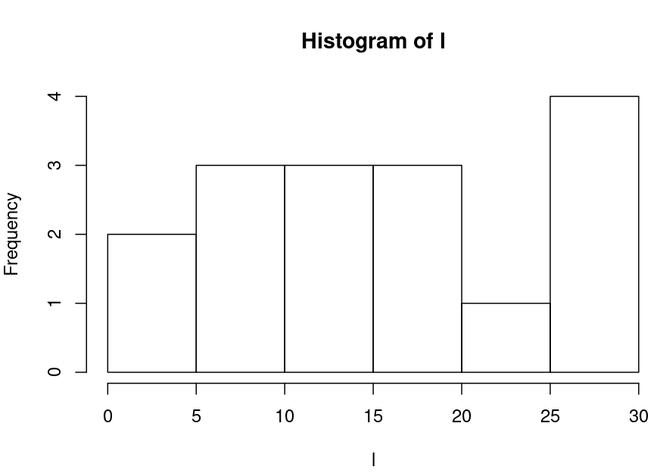
Histograms in R can be created using the hist() function. All you do is just pass the data to the function and it'll plot it for you. Let's go ahead and create a histogram.
Output:
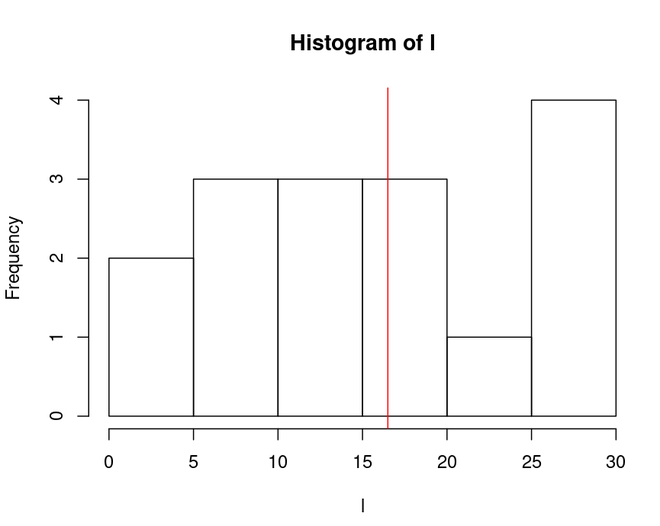
👁 ImageNow that we have created our histogram let's add mean and median lines to it. To find the mean and median lines to it. But before adding them let's find them to find the mean and median of data in R we can use mean() and median() functions.
mean <- mean(l) # Mean: 16.25
med <- median(l) # Meadian: 16.5
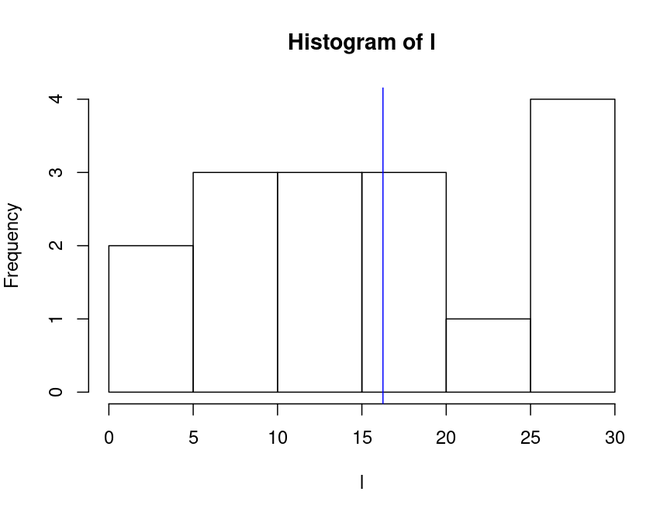
Now that we have the mean and median let's add mean to the plot by using abline() function and set its color as blue.
abline(v = mean, col = 'blue')
Example 1: Add Mean to Histogram in R
Output:
👁 ImageExample 2: Add Median to Histogram in R
Let's add median to the plot by using abline() function and set its color as red.
abline(v = med, col = 'red')👁 Image