 |
VOOZH | about |
|
VOOZH | about |
In the world of data, time-series data refers to information collected over time. When we talk about "irregular time-series data," we mean data collected at inconsistent or random times, rather than at fixed, regular intervals. This article will explain about irregular time-series data , how to handle it, and how to analyze it effectively.
An irregular time-series is a collection of data points collected at uneven or random times, not at regular intervals. For example, if you record the temperature whenever you feel like it, rather than every hour or every day, that’s irregular. It’s different from regular time-series data, where you collect data at consistent intervals, like every hour or every day.
Once your data is ready, you can analyze it using different techniques:
Let's implement stepwise How to handle Irregular Time-Series in R Programming Language.
First we will Install and Load Required Packages.
Now we will Create Irregular Time-Series Data.
Output:
Irregular Time-Series Data:
2024-01-01 2024-01-03 2024-01-04 2024-01-10 2024-01-11 2024-01-15
 10 15 NA 25 30 NA
Now we will Resample to Regular Intervals.
Output:
Resampled Regular Time-Series Data:
2024-01-01 2024-01-02 2024-01-03 2024-01-04 2024-01-05 2024-01-06 2024-01-07
 10 NA 15 NA NA NA NA
2024-01-08 2024-01-09 2024-01-10 2024-01-11 2024-01-12 2024-01-13 2024-01-14
 NA NA 25 30 NA NA NA
2024-01-15
 NA
Now we will Interpolate Missing Values.
Output:
Interpolated Time-Series Data:
2024-01-01 2024-01-02 2024-01-03 2024-01-04 2024-01-05 2024-01-06 2024-01-07
 10.00000 12.50000 15.00000 16.42857 17.85714 19.28571 20.71429
2024-01-08 2024-01-09 2024-01-10 2024-01-11 2024-01-12 2024-01-13 2024-01-14
 22.14286 23.57143 25.00000 30.00000 30.00000 30.00000 30.00000
2024-01-15
 30.00000
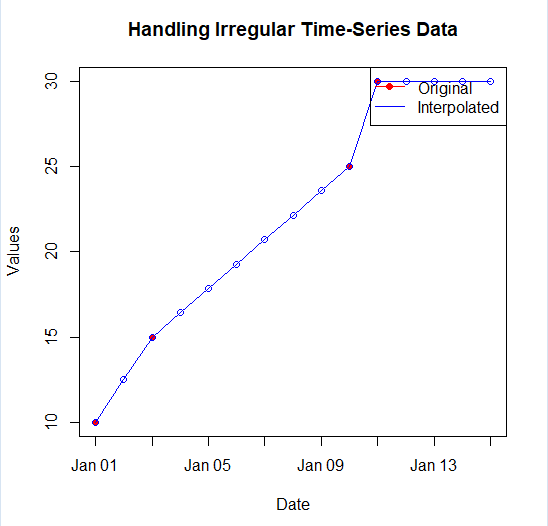
At last we will visualize the data.
Output:
valid_range Calculation: Ensures that the y-axis range includes all data points.plot() Function: Plots the original data as points.lines() Function: Adds the interpolated data as a line to the existing plot.legend() Function: Adds a legend to differentiate between original and interpolated data.Working with irregular time-series data involves modifying the data to address issues like varying frequencies and missing values. In R, this can be done through resampling, interpolation, and specialized packages. These techniques help manage irregular intervals, improving the accuracy of forecasts and analyses. Effectively handling irregular time-series data enhances the reliability of statistical models and supports better decision-making across various fields.