 |
VOOZH | about |
|
VOOZH | about |
In this article, we will calculate autocorrelation in R programming language
Autocorrelation is used to measure the degree of similarity between a time series and a lagged version of itself over the given range of time intervals. We can also call autocorrelation as “serial correlation” or “lagged correlation”. It is mainly used to measure the relationship between the actual values and the previous values.
In R, we can calculate the autocorrelation in a vector by using the module tseries. Within this module, we have to use acf() method to calculate autocorrelation.
Syntax:
acf(vector, lag, pl)
Parameter:
- vector is the input vector
- lag represents the number of lags
- pl is to plot the auto correlation
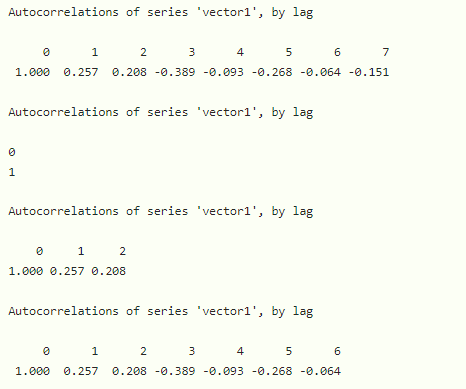
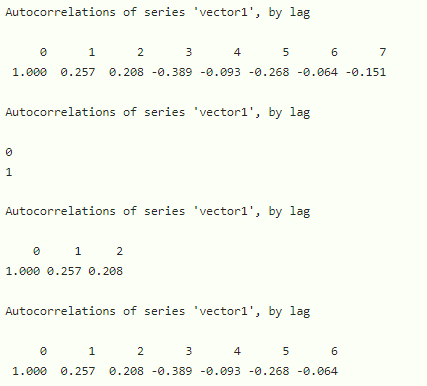
Example: R program to calculate auto correlation in a vector with different lags
Output:
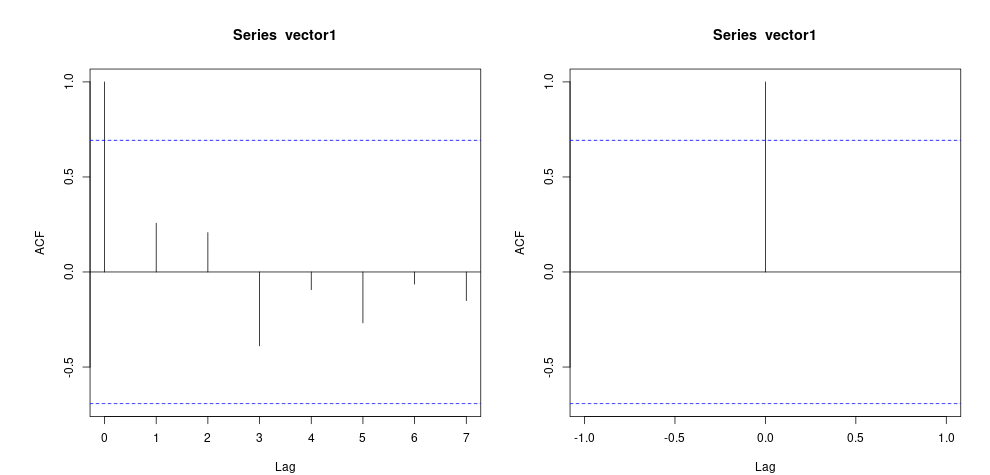
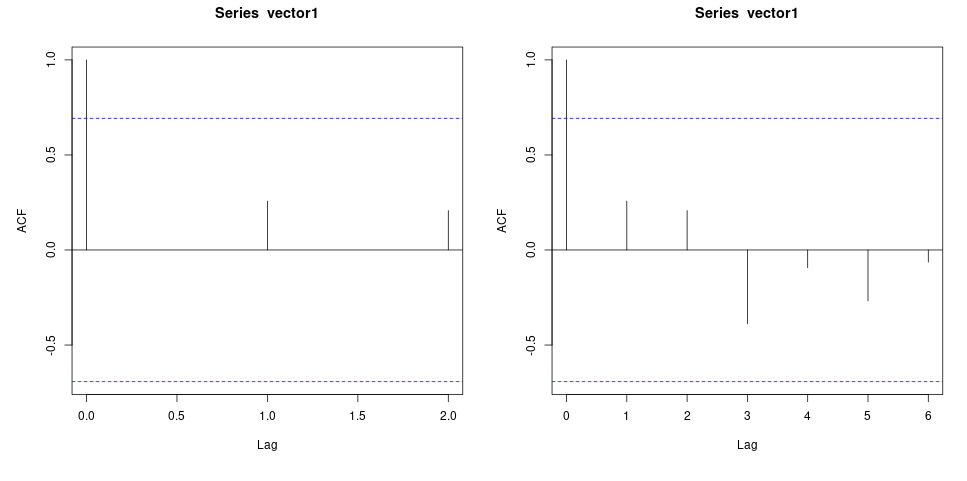
👁 ImageThe same function can be used to visualize the output produced for that we simply have to set pl to TRUE
Example: Data visualization
Output:
👁 Image