 |
VOOZH | about |
|
VOOZH | about |
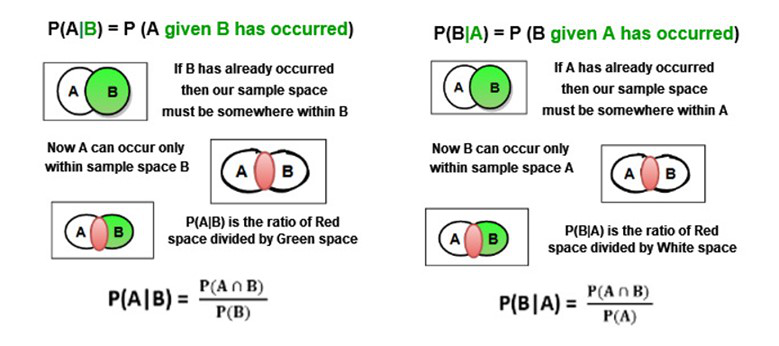
Conditional probability is the probability of one event occurring given that another event has already occurred. It helps in understanding how the likelihood of one outcome is affected by the knowledge of another outcome.
The formula for conditional probability is:
The below figure depicts the Venn diagram representation
👁 ImageFrom a pack of 50 Pokémon cards, a card is drawn at random. These 50 cards have 5 equal sets of red, blue, green, yellow and black cards respectively and each set has 2 water-type Pokémon with one water type being of high strength and the other one being of medium strength.
Considering A to be the event of drawing a high strength water-type Pokémon card and B to be the event of drawing a red card, what is the probability of drawing a high-strength, water-type Pokémon card with the red card already been drawn?
Solution:
(since there are 10 red cards within a pack of 50 Pokémon cards.)
(as there are 5 high-strength water-type Pokémon cards within a pack of 50 cards.)
(as there is one red high strength water-type Pokémon card within a pack of 50 cards)
Since event B has already occurred hence there are 10 exhaustive cases and not 50 as earlier. Amongst these 10 red Pokémon cards, there is 1 high-strength, water-type Pokémon card.
Hence,
This is the conditional probability of A given that B has already occurred.
Similarly,
As there can be only 1 red high strength water-type Pokémon card within the high strength water-type Pokémon card already drawn from pack of 50 cards.
A store owner has a list of 15 customers. He observes certain patterns in their purchases which are depicted in the table below.
Customers | Money spent | Frequency |
|---|---|---|
1 | High | Less |
2 | Low | More |
3 | High | More |
4 | High | Less |
5 | Low | Less |
6 | Low | More |
7 | High | More |
8 | Low | Less |
9 | Low | Less |
10 | High | More |
11 | Low | More |
12 | Low | Less |
13 | High | Less |
14 | High | More |
15 | High | Less |
Based on the above table, he is interested in finding out
Solution:
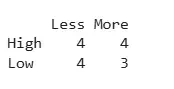
P(High Spend | Less Frequency)
(as from the table,8 times out of 15, frequency is less)
(as from the table, there are 4 combinations out of 15 with high spend and less frequency)
P(Low Spend | More Frequency)
( as from the table,7 times out of 15, frequency is less)
(as from the table, there are 3 combinations out of 15 with low spend and more frequency)
Similarly,
The above example demonstrates how to apply the conditional probability formula using frequency data.
We are calculating conditional probabilities for a dataset using R programming language. This helps us understand the relationship between money spent and frequency of visits.
We are creating a dataset with two categorical variables: money spent and visit frequency.
We are generating a contingency table to see how often each combination of the two variables occurs.
Output:
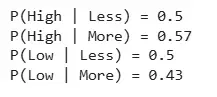
We are calculating the probability of one variable given the value of another using the frequency table.
We are displaying the calculated conditional probabilities.
Output:
These results show that people who spend high money are more likely to visit less, while those who spend low money are more likely to visit more.