 |
VOOZH | about |
|
VOOZH | about |
In this article, we are going to learn how to draw the Poisson density curve in the R programming language.
Function used:
dpois(): The dpois() method is used to accept the vector of quantiles and the vector of means as the input parameters. The dpois() method has the following syntax :
Syntax: dpois (q, m)
Arguments :
- q - Vector of quantiles.
- m - Vector of means.
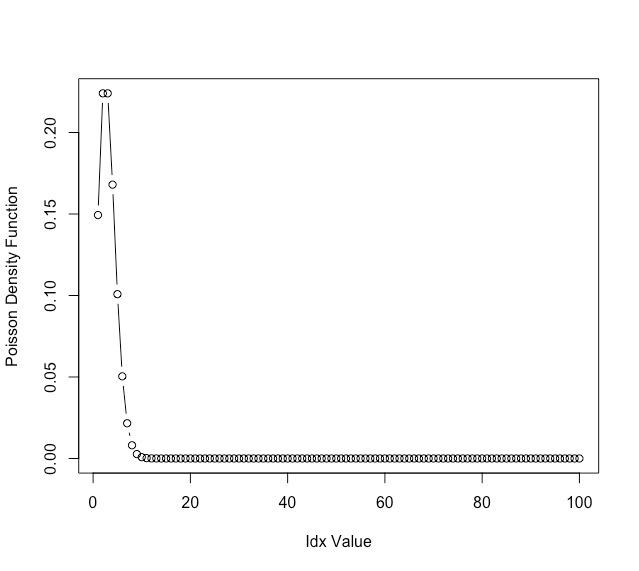
To draw the Poisson density curve for vectors firstly we are declaring data points from 1 to 100 and specify the lambda value as 3 and after that using the plot() method to plot the Poisson density curve on a graph with dpois() method inside it to accept the vector quantiles.
Output:
> print(data_points)
[1] 1 2 3 4 5 6 7 8 9 10 11 12 13 14 15 16 17 18 19 20 21 22 23 24
[25] 25 26 27 28 29 30 31 32 33 34 35 36 37 38 39 40 41 42 43 44 45 46 47 48
[49] 49 50 51 52 53 54 55 56 57 58 59 60 61 62 63 64 65 66 67 68 69 70 71 72
[73] 73 74 75 76 77 78 79 80 81 82 83 84 85 86 87 88 89 90 91 92 93 94 95 96
[97] 97 98 99 100
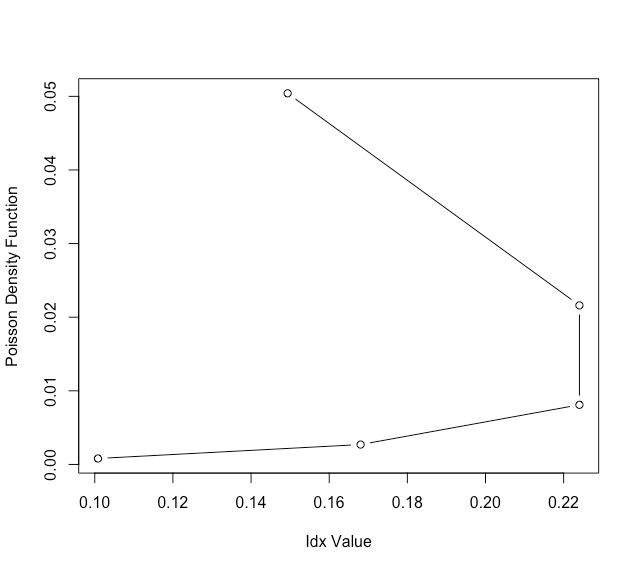
Here, we are creating the matrix of data points and using them to plot the Poisson density curve as same as above graph.
Output:
> print(data_points)
[,1] [,2] [,3] [,4]
[1,] 1 6 11 16
[2,] 2 7 12 17
[3,] 3 8 13 18
[4,] 4 9 14 19
[5,] 5 10 15 20