 |
VOOZH | about |
|
VOOZH | about |
In R programming, missing values are represented using NA. Before analysis, it is important to identify where missing values occur and how many are present. R provides simple built-in functions like is.na(), which() and sum() to handle this task.
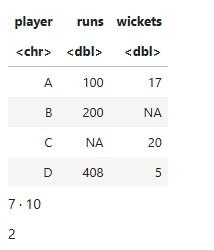
Consider a small data frame containing player statistics, where some values are missing:
Output:
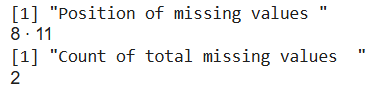
which(is.na(data))
sum(is.na(data))
Parameters:
We create a data frame named stats and use which(is.na()) to get the positions of missing values and sum(is.na()) to get the total number.
TRUE values by summing them (as TRUE = 1, FALSE = 0).Output:
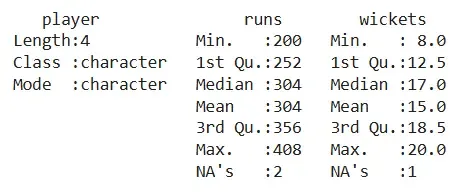
We use summary() to get statistical details of each column, including the number of missing values.
Output:
We use colSums() with is.na() to count NA values in each column.
Output:
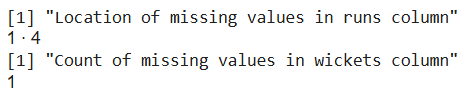
We check the missing values in specific columns using dataframe$column.
Output:
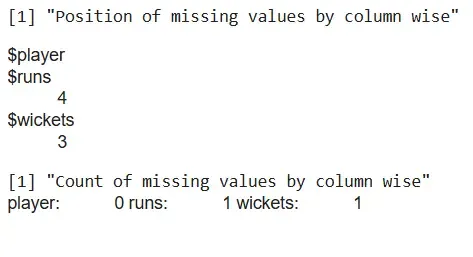
We use sapply() to apply functions column-wise and identify NA positions and counts.
Output:
The output shows the position and count of missing values in each column. The runs column has a missing value at position 4 and wickets has one at position 3, while player has no missing values. This helps quickly locate and quantify missing data column-wise.