 |
VOOZH | about |
|
VOOZH | about |
A confidence interval is a range of values used to estimate an unknown population parameter, such as the mean or proportion. It shows how much uncertainty is associated with a sample estimate. The interval is calculated from sample data and includes a confidence level, usually 95%, which means that if we repeat the sampling process many times, about 95% of the calculated intervals would contain the true value.
Parameters:
We use the t.test() function to find the confidence interval of the sample mean in R programming language.
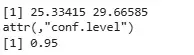
Output:
We can say with 95% confidence that the true mean lies between 25.33415 and 29.66585.
We manually calculate the confidence interval for the mean of Sepal.Length from the iris dataset using statistical formulas.
Output:
[1] 5.709732 5.976934
We can be 95% confident that the population mean of Sepal.Length lies between 5.709732 and 5.976934.
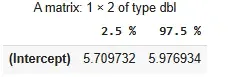
We fit a simple linear model to calculate the mean and use confint() to get the confidence interval.
Output:
We are 95% confident that the true population mean of Sepal.Length lies between 5.709732 and 5.976934. This matches the results we got in the manual method.