 |
VOOZH | about |
|
VOOZH | about |
Using custom fonts in ggplot2 graphs can enhance the visual appeal of data visualizations. One way to achieve this is by integrating Google Fonts into R plots. Google Fonts offers a wide variety of font styles, and in this article, we will walk through how to incorporate them into your ggplot2 graphs. In R, fonts can be managed using packages like sysfonts, showtext, and extrafont, which allows loading, registering, and applying Google Fonts to your plots.
Custom fonts, like those available through Google Fonts, allow for a more personalized and professional look in your visualizations. They can be used for:
To use Google Fonts in your ggplot2 graphs, you need the following R packages:
Install and load the Required Packages:
# Install required packages
install.packages("sysfonts")
install.packages("showtext")
install.packages("ggplot2")

# Load the necessary libraries
library(sysfonts)
library(showtext)
library(ggplot2)
Now we will discuss step by step How to implement Google Fonts in ggplot2 graphs using R Programming Language:
The sysfonts package allows you to easily add Google Fonts to your system using the font_add_google() function. For example, to add the popular Roboto font:
Here, "Roboto" is the name of the font from Google Fonts, and "roboto" is the font family name that we will reference later.
The showtext package makes it easy to use custom fonts in ggplot2 plots. It uses a text rendering system that works well with non-standard fonts.
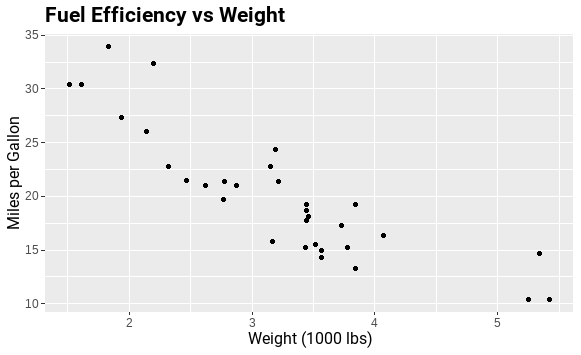
Now that we have registered and loaded a Google Font, we can use it in a ggplot2 plot. Let’s create a simple plot using the Roboto font for both axis labels and title.
Output:
In this example, we use the Roboto font for the plot title, X-axis label, and Y-axis label. The element_text() function allows us to specify the font family, size, and other stylistic options.
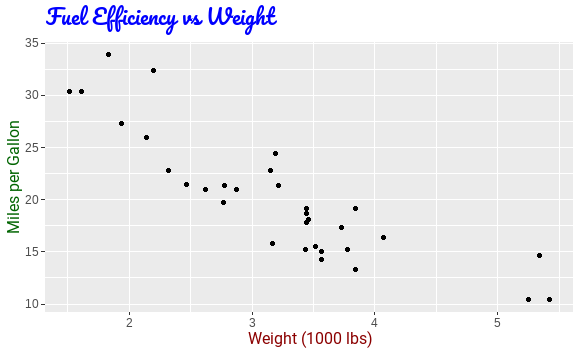
You are not limited to just one Google Font. The font_add_google() function allows you to download and use any font available in the Google Fonts library. Here’s an example of using two different Google Fonts in one plot.
Output:
In this plot, the title uses the Pacifico font, while the axis labels use the Roboto font. The result is a customized and visually appealing plot with a combination of fonts.
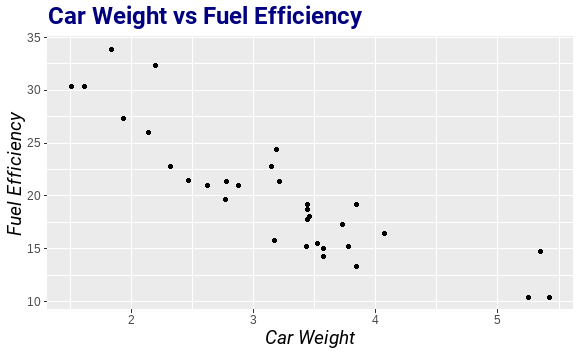
You can also control the size and style (e.g., bold, italic) of the font using the element_text() function within the theme() function.
size argument.face argument to specify bold, italic, or normal text.Output:
implementing Google Fonts into ggplot2 graphs in R allows for enhanced customization and aesthetic improvements. By using the sysfonts and showtext packages, you can easily load, manage, and apply a wide variety of fonts directly from Google Fonts. This customization improves the readability, professionalism, and visual appeal of your plots, making them more suitable for presentations, reports, and publications.