 |
VOOZH | about |
|
VOOZH | about |
Principal Component Analysis (PCA) is a popular dimensionality reduction technique used in data science and machine learning. The factoextra package in R provides useful functions for visualizing PCA results, and one of the key functions is fviz_pca_ind(), which helps in visualizing the individuals (rows or observations) of a PCA.
The fviz_pca_ind() function from the factoextra package is widely used to visualize the results of Principal Component Analysis (PCA) in R. However, there are cases where you may want to simplify the plot by hiding the legend. In this article, we'll show you how to use fviz_pca_ind() to generate PCA plots without displaying the legend.
fviz_pca_ind(res.pca, geom = "point", label = "none", addEllipses = TRUE, legend = "none")
Where,
res.pca: The result of the PCA performed byprcomp()orPCA()(fromFactoMineR).geom: Type of geometry to display for individuals .label: Labels for individuals (e.g., "none", "all", or a subset of individuals).addEllipses: Whether to add confidence ellipses around groups of individuals.legend: Controls the display of the legend .
Now we will discuss step by step How to Plot with fviz_pca_ind() Without Showing the Legend Using R Programming Language.
Before starting, you need to install the necessary libraries if they aren’t already installed:
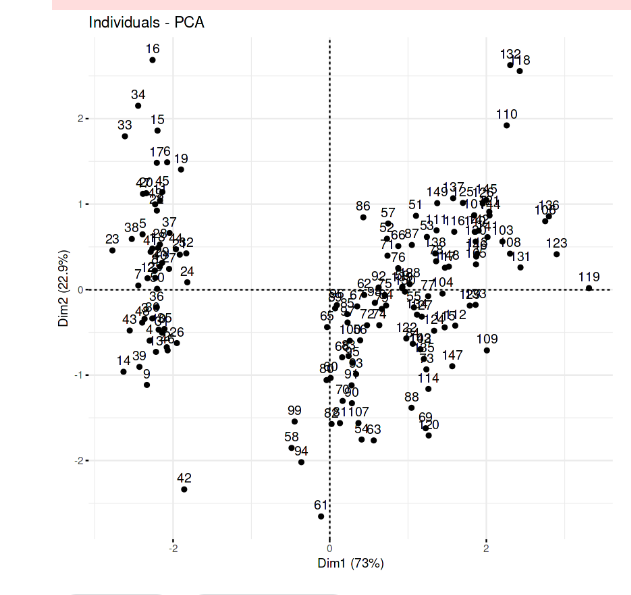
You can use fviz_pca_ind() to plot individuals and observe clusters or patterns. By default, the plot includes a legend, but you can control whether to show or hide the legend.
Output:
This will produce a PCA plot showing the individuals (rows) of the dataset, with the default legend displaying groups or categories.
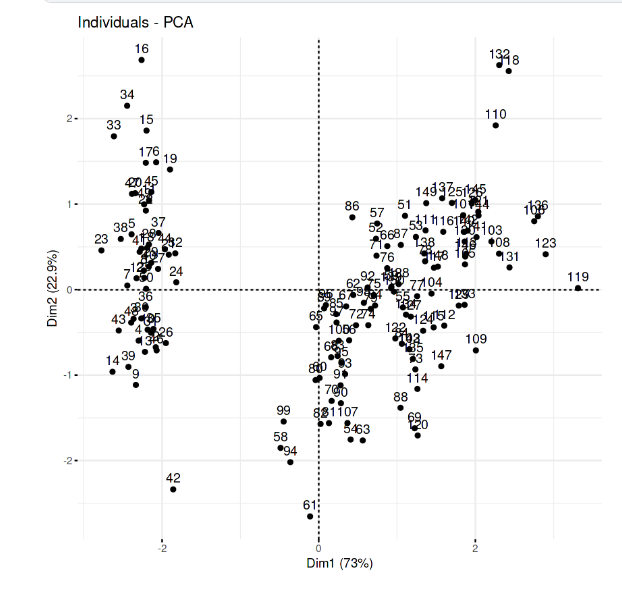
In fviz_pca_ind(), the legend is automatically generated based on the grouping of individuals, but you may want to hide it for a cleaner plot. This can be done by adjusting the legend parameter using theme().
Here’s how you can modify the code to plot PCA results without displaying the legend:
Output:
In this article, we demonstrated how to use fviz_pca_ind() to create PCA plots in R without showing the legend. This can be helpful when you want to simplify your plots or avoid unnecessary distractions. By setting the legend argument to "none", you can easily remove the legend from the PCA visualization while still retaining other essential aspects of the plot, such as points, colors, and ellipses.