 |
VOOZH | about |
|
VOOZH | about |
In R programming, ggplot2 is a powerful and widely used package for data visualization. It allows users to create aesthetically pleasing and highly customizable visualizations. One of the most common themes used ggplot2 is theme_bw(), which stands for "black and white." This theme provides a clean, minimalist look to plots by removing the background grid and unnecessary clutter, making the visualization using R Programming Language.
theme_bw()when using theme_bw(), many users encounter grey borders around individual legend entries. This can be undesirable in some cases, especially when the goal is to have a more streamlined or border-free legend. Fortunately, ggplot2 provides various customization options to remove these grey borders and make the legend look cleaner.
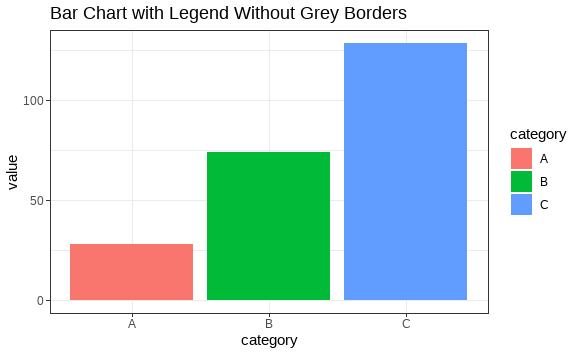
ggplot2 PlotBy default, when using theme_bw(), grey borders may appear around the legend keys (the small boxes or lines next to the legend labels). This is because theme_bw() applies a default style that includes borders around each individual legend item.
Output:
This code will generate a bar chart where each legend key has a grey border around it. We will now explore how to remove these borders and customize the appearance of the legend.
In ggplot2, the legend.key refers to the small squares, lines, or other shapes that correspond to the legend entries. The grey borders can be removed by setting the legend.key to have a transparent background and no border.
theme()We can customize the legend key's appearance using the following code:
Output:
In this example, we use element_rect() inside the theme() function to remove the grey borders by setting both the fill and color arguments to NA (which means "no fill" and "no color").
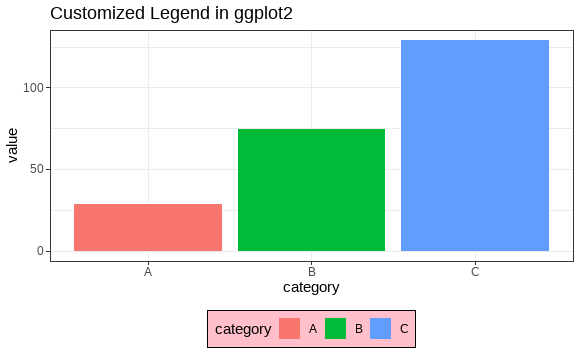
In addition to removing the grey borders, you can further customize the appearance of the legend to match your desired style. For example, you can adjust the legend's background, position, text, and more.
Output:
In this example, we've customized the legend further by:
legend.background.legend.position.Removing grey borders around individual entries in the ggplot2 legend when using theme_bw() is a common requirement for improving the aesthetics of your plots. By using the theme() function and setting the legend.key element with element_rect(), you can easily remove these borders and create cleaner, more professional-looking visualizations.