 |
VOOZH | about |
|
VOOZH | about |
Data transformation in R can be performed using the tidyverse and dplyr packages, which offer various methods for data manipulation. These packages can be easily installed and provide a range of techniques for data transformation.
The tidyverse and dplyr package can be installed by install.packages() function.
We will use the arrange() function to create an order for the sequence of the observations given. The arrange() method in the tidyverse package inputs a list of column names to rearrange them in a specified order. By default, the arrange() method arranges the data in ascending order.
Syntax: arrange(col-name)
Parameter:
- col-name - Name of the column.
We are creating a data frame with numeric and character columns, then arranging the data frame by the col1 values in ascending order using the arrange() function from the tidyverse package. We print both the original and the rearranged data frames.
Output:
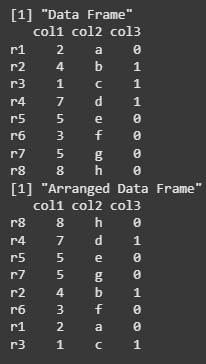
We are creating a data frame with numeric and character columns, then arranging the data frame by col1 in descending order using the arrange() function from the tidyverse package. We print both the original and the rearranged data frames.
Output:
We will use the select() function from the tidyverse package to fetch columns in the specified order. This method returns a subset of the data frame containing only the selected columns.
Syntax: select(list-of-col-names)
Parameter:
- list-of-col-names - List of column names separated by comma.
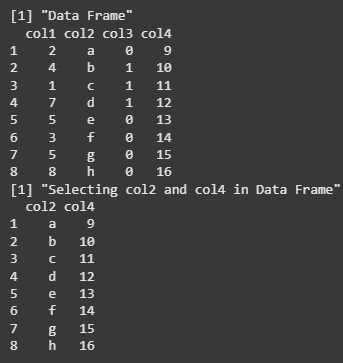
We are creating a data frame with four columns (col1, col2, col3, col4), then using the select() function from the tidyverse package to select only the col2 and col4 columns. The result is a subset of the original data frame, which is then printed.
Output:
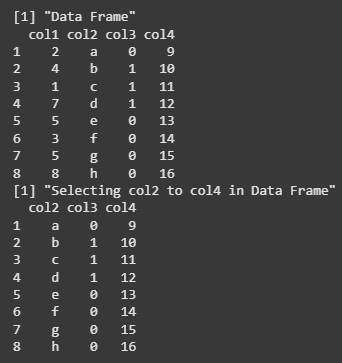
We are creating a data frame with four columns (col1, col2, col3, col4), then using the select() function from the tidyverse package to select columns from col2 to col4. The result is a subset of the original data frame containing only the selected columns, which is then printed.
Output:
The filter() method in the tidyverse package is used to apply a range of constraints and conditions to the column values of the data frame. It filters the data and results in the smaller output returned by the column values satisfying the specified condition. The conditions are specified using the logical operators, and values are validated then.
Syntax: filter(cond1, cond2)
Parameter:
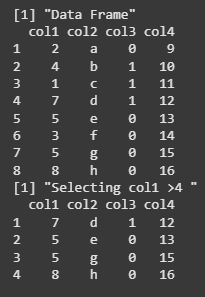
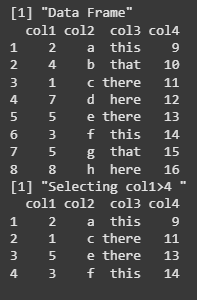
We are creating a data frame with four columns (col1, col2, col3, col4), then using the filter() function from the tidyverse package to select rows where the value of col1 is greater than 4. The filtered data frame is then printed.
Output:
We are creating a data frame with four columns (col1, col2, col3, col4), then using the filter() function from the tidyverse package to select rows where col3 contains either "there" or "this" using the %in% operator. The filtered data frame is then printed.
Output:
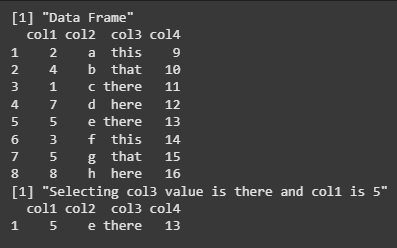
We are creating a data frame with four columns (col1, col2, col3, col4), then using the filter() function from the tidyverse package to select rows where col3 is "there" and col1 is 5. The filtered data frame is then printed.
Output:
The spread method is used to spread any key-value pair in multiple columns in the data frame. It is used to increase the readability of the data specified in the data frame. The data is rearranged according to the list of columns in the spread() method.
Syntax:spread(col-name)
Parameter:
- col-name - Name of one or more columns according to which data is to be structured.
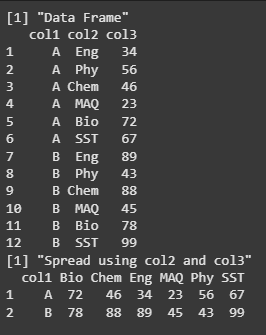
We are creating a data frame with three columns (col1, col2, col3), then using the spread() function from the tidyverse package to reshape the data by spreading col2 values into individual columns and filling the col3 values accordingly. The reshaped data frame is then printed.
Output:
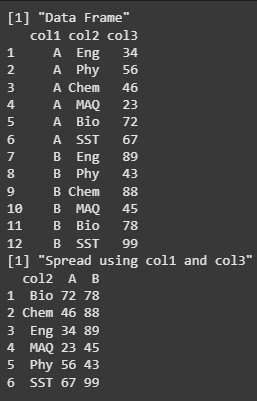
We are creating a data frame with three columns (col1, col2, col3), then using the spread() function to reshape the data by turning unique values from col1 ("A" and "B") into separate columns, and filling them with corresponding values from col3, using col2 as the row identifier. The transformed data frame is then printed.
Output:
The mutate() method is used to create and modify new variables in the specified data frame. A new column name can be assigned to the data frame and evaluated to an expression where constants or column values can be used. The output data frame has the new columns created.
Syntax: mutate (new-col-name = expr)
Parameters:
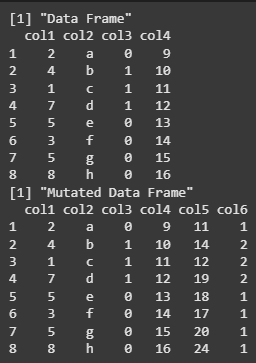
We are creating a data frame with four columns and then using the mutate() function to add two new columns: col5 (the sum of col1 and col4) and col6 (col3 incremented by 1). The updated data frame with the new columns is then printed.
Output:
The group_by()and summarise() methods are used collectively to group by variables of the data frame and reduce multiple values down to a single value. It is used to make the data more readable. The column name can be specified in R's group_by() method.
Syntax: group_by(col-name)
Syntax: group_by(col,..) %>% summarise(action)
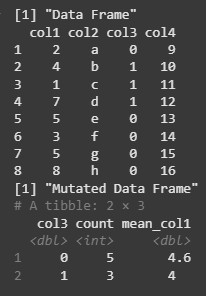
We are grouping the data frame by col3 and then using summarise() to calculate the count of rows and the mean of col1 within each group. The resulting summary table is then printed.
Output:
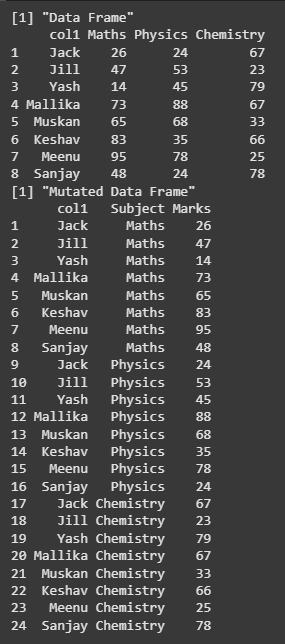
The gather() function to reshape the data by combining columns col2 to col4 into key-value pairs. The column names are stored under "Subject", and their corresponding values form a new column.
Syntax: gather(data, key, value)
We are using the gather() function from the dplyr package to reshape the data frame from wide to long format. Columns Maths, Physics, and Chemistry are combined into two columns: "Subject" (holding the subject names) and "Marks" (holding the corresponding values).
Output:
In this article, we explored how to reshape and transform data in R using functions like gather(), spread(), mutate(), filter(), and select() from the tidyverse and dplyr packages. These functions make it easier to manipulate and analyze data efficiently by changing its structure to suit different analysis needs.