 |
VOOZH | about |
|
VOOZH | about |
The summary() function provides a quick statistical overview of a given dataset or vector. When applied to numeric data, it returns the following key summary statistics:
summary(data)
Where, data can be a vector, dataframe, etc. In this article, we will explore the summary() function in the R programming language.
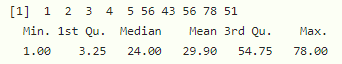
Here we are going to create a vector with some elements and get the summary statistics using the summary() function.
Output:
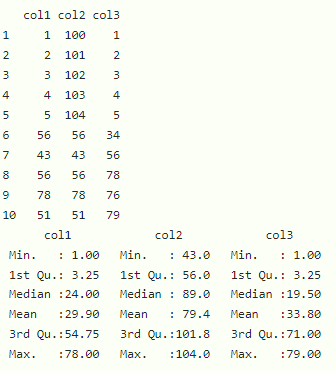
Here we are going to get the summary of all columns in the dataframe.
Output:
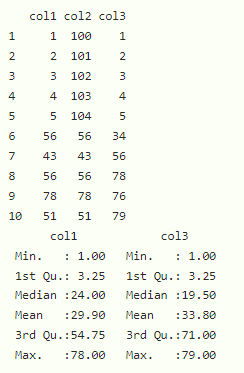
Here we can get summary of particular columns of the dataframe.
Syntax:
summary(dataframe[c 1="'column2',..,column" 2="n)" language="('column1',"][/c])
Output:
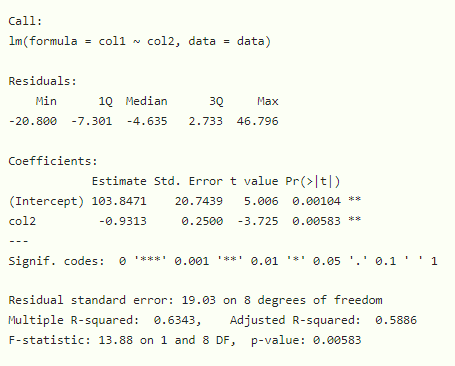
Here we can also calculate summary() for linear regression model. We can create an linear regression model for dataframe columns using lm() function.
Syntax:
summary(lm(column1~column2, dataframe))
Output:
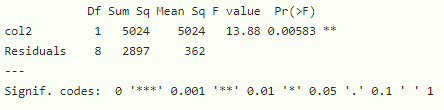
Here aov() is used to create ANOVA (Analysis of Variance) model which stands for analysis of variance.
Syntax:
summary(aov(col1 ~ col2, data))
Example:
Output: