 |
VOOZH | about |
|
VOOZH | about |
Human Resource Management plays an important role in any organization and business to evaluate the company's growth and performance based on the employees. This helps in analyzing the human assets working in a company and how they can be motivated to do better by different means. Human Resource Management helps in deriving useful information from employee data to make the working environment better and more efficient.
There are various needs for having HRM in a company:
Now we will discuss step by step to create Human Resource Management Analytics Dashboard in R Programming Language.
Replace the path of the dataset from the original one. We are using multiple libraries to for our dashboard.
Dataset Link:Human Resource Management Analytics
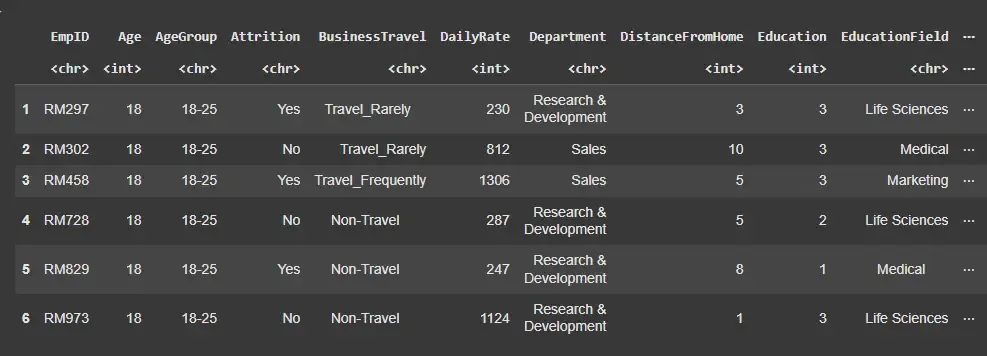
This dataset contains 1480 observations and 38 variables, representing various employee attributes and metrics.
Output:
Data preprocessing is a crucial step to ensure the data is clean and ready for analysis. Here, we will handle missing values, convert data types and create new variables as needed.
Output:
[1] 57
This step is important to identify and explore the dataset so that we can analyze it and make informed decisions. Here, we will create multiple such visualization to understand better.
Output:
This pie chart indicates that the total employees of the given company has 60% male employees and 40% female.
Now we will visualize the Education Level of Employees.
Output:
This will give us insights about the age group of the employees.
Output:
As we can see that the age group from 30-40 have the highest number of employees.
This explains us the kind of jobs provided and the number of employees in the certain sector.
Output:
The highest number of job roles in the company is sales executive.
This helps us analyze the income of the employees.
Output:
This plot will help us estimate the gender ratio in the company for better hiring to maintain equality and diversity.
Output:
As we can see the least number of female employee is in Human resource department.
A well-designed HR Management Analytics Dashboard provides important insights into various aspects of the workforce, enabling better management and strategic planning.
Here we will build a dashboard which will help us navigate through different department and get all the necessary insights related to including an overview, employee engagement and attrition analysis.
Output:
Here we can navigate and find different insights on the particular department. With the help of the toggle bar we can select the department we want.
The UI layout consists of a title, a sidebar for navigation and a main panel for displaying the plots and metrics. The sidebar allows navigation through different departments and time periods.
Output:
In this article, we discussed the importance of HR management and the role of machine learning in it. We used R and its libraries to evaluate and analyze employee performance. We built multiple graphs to get insights as well as dashboards to understand it better.