 |
VOOZH | about |
|
VOOZH | about |
The tidyverse is a collection of packages that work well together due to shared data representations and API design. The tidyverse package is intended to make it simple to install and load core tidyverse packages with a single command.
To install tidyverse, put the following code in RStudio:
Output:
── Attaching packages ─────────────────────────────────────────────────────── tidyverse 1.3.2 ──
✔ ggplot2 3.3.6 ✔ purrr 0.3.5
✔ tibble 3.1.8 ✔ dplyr 1.0.10
✔ tidyr 1.2.1 ✔ stringr 1.4.1
✔ readr 2.1.3 ✔ forcats 0.5.2
── Conflicts ────────────────────────────────────────────────────────── tidyverse_conflicts() ──
✖ dplyr::filter() masks stats::filter()
✖ dplyr::lag() masks stats::lag()
The tidyr package will be used for data cleaning, and the readr package will be used for data loading.
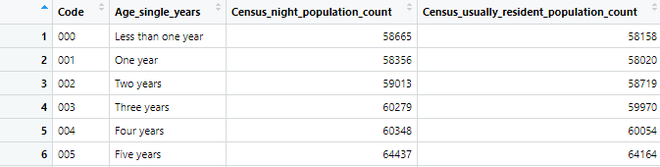
Dear Friends, In this tutorial, we will read and parse a CSV file using the readr package's read CSV function. CSV (Comma-Separated Values) files contain data separated by commas. The following CSV file will be used in the following example. To begin, pass the path to the file to be read to the read_csv function. The read CSV function generates tibbles that can be attached to variables.
Output:
chr (2): ── Column specification ────────────────────────────────────────────────────────────
Delimiter: ","
chr (2): Code, Age_single_years
dbl (2): Census_night_population_count, Census_usually_resident_population_count

ℹ Use `spec()` to retrieve the full column specification for this data.
ℹ Specify the column types or set `show_col_types = FALSE` to quiet this message
Inline CSV input is very useful, and these options can also help you in normal file parsing too.
Output:
 a b c
 <dbl> <dbl> <dbl>
1 1 2 3
2 4 5 6
The first line of a CSV file is the name of the columns. However, there are other options for dealing with exceptions.
Output:
 x y z
 <dbl> <dbl> <dbl>
1 1 2 3
Output:
 x y z
 <dbl> <dbl> <dbl>
1 1 2 3
2 4 5 6
If the first line is not the name of the columns, then we can do this
Output:
 X1 X2 X3
 <dbl> <dbl> <dbl>
1 1 2 3
2 4 5 6
Output:
 COLUMN1 COLUMN2 COLUMN3
 <dbl> <dbl> <dbl>
1 1 2 3
2 4 5 6
Output:
 a b c
 <dbl> <dbl> <lgl>
1 1 2 NA
There are three rules of tidy data.
First, see examples of tidy and untidy data.
Output:
 country year cases population
 <chr> <int> <int> <int>
1 Afghanistan 1999 745 19987071
2 Afghanistan 2000 2666 20595360
3 Brazil 1999 37737 172006362
4 Brazil 2000 80488 174504898
5 China 1999 212258 1272915272
6 China 2000 213766 1280428583
Examples of untidy data and how to deal with it.
In table2, a single observation is scattered across several rows, this can be fixed by using the pivot_wider() option
Output:
 country year type count
 <chr> <int> <chr> <int>
 1 Afghanistan 1999 cases 745
 2 Afghanistan 1999 population 19987071
 3 Afghanistan 2000 cases 2666
 4 Afghanistan 2000 population 20595360
 5 Brazil 1999 cases 37737
 6 Brazil 1999 population 172006362
 7 Brazil 2000 cases 80488
 8 Brazil 2000 population 174504898
 9 China 1999 cases 212258
10 China 1999 population 1272915272
11 China 2000 cases 213766
12 China 2000 population 1280428583
Output:
 country year cases population
 <chr> <int> <int> <int>
1 Afghanistan 1999 745 19987071
2 Afghanistan 2000 2666 20595360
3 Brazil 1999 37737 172006362
4 Brazil 2000 80488 174504898
5 China 1999 212258 1272915272
6 China 2000 213766 1280428583
In table three, we have to separate two values in a column.
Output:
 country year rate
* <chr> <int> <chr>
1 Afghanistan 1999 745/19987071
2 Afghanistan 2000 2666/20595360
3 Brazil 1999 37737/172006362
4 Brazil 2000 80488/174504898
5 China 1999 212258/1272915272
6 China 2000 213766/1280428583
Output:
 country year cases population
 <chr> <int> <chr> <chr>
1 Afghanistan 1999 745 19987071
2 Afghanistan 2000 2666 20595360
3 Brazil 1999 37737 172006362
4 Brazil 2000 80488 174504898
5 China 1999 212258 1272915272
6 China 2000 213766 1280428583
“cases” and “population” are character columns, which is the default behavior in separate(). It leaves the type of the column as it is, we can convert to better types using “convert = TRUE".
Output:
 country year cases population
 <chr> <int> <int> <int>
1 Afghanistan 1999 745 19987071
2 Afghanistan 2000 2666 20595360
3 Brazil 1999 37737 172006362
4 Brazil 2000 80488 174504898
5 China 1999 212258 1272915272
6 China 2000 213766 1280428583
You can also pass an integer to “sep” which will interpret the integers as positions to split at. Indexing from 1 from the left and -1 from the right.
Output:
 country century year rate
 <chr> <chr> <chr> <chr>
1 Afghanistan 19 99 745/19987071
2 Afghanistan 20 00 2666/20595360
3 Brazil 19 99 37737/172006362
4 Brazil 20 00 80488/174504898
5 China 19 99 212258/1272915272
6 China 20 00 213766/1280428583
When some column names are not names of variables, but values of a variable.
Output:
 country `1999` `2000`
* <chr> <int> <int>
1 Afghanistan 745 2666
2 Brazil 37737 80488
3 China 212258 213766
Output:
 country year cases
 <chr> <chr> <int>
1 Afghanistan 1999 745
2 Afghanistan 2000 2666
3 Brazil 1999 37737
4 Brazil 2000 80488
5 China 1999 212258
6 China 2000 213766
Use “unite()” to rejoin the century and year columns that we created in the last example. “unite()” takes a tibble and the name of the new variable to create, and a column to combine.
Output:
 country new rate
 <chr> <chr> <chr>
 1 Afghanistan 19_99 745/19987071
 2 Afghanistan 20_00 2666/20595360
 3 Brazil 19_99 37737/172006362
 4 Brazil 20_00 80488/174504898
 5 China 19_99 212258/1272915272
 6 China 20_00 213766/1280428583
We also need to use the sep argument, because by default R will place an underscore (_) between the values from different columns. Here we don’t want any separator, so we use “”,
Output:
 country new rate
 <chr> <chr> <chr>
 1 Afghanistan 1999 745/19987071
 2 Afghanistan 2000 2666/20595360
 3 Brazil 1999 37737/172006362
 4 Brazil 2000 80488/174504898
 5 China 1999 212258/1272915272
 6 China 2000 213766/1280428583
A value can be missing in two ways,
There are two missing values here,
We can make the implicit missing value explicit by putting years in the columns:
Output:
 country cases `1999` `2000`
 <chr> <dbl> <dbl> <dbl>
1 Afghanistan 745 19987071 NA
2 Afghanistan 2666 NA 20595360
3 Brazil 37737 172006362 NA
4 China 80488 NA NA
5 China 212258 NA 1280428583
You can set “values_drop_na = TRUE" in “pivot_longer()” to turn explicit missing values implicit,
Output:
 country cases year population
 <chr> <dbl> <chr> <dbl>
1 Afghanistan 745 1999 19987071
2 Afghanistan 2666 2000 20595360
3 Brazil 37737 1999 172006362
4 China 212258 2000 1280428583
complete() takes a set of columns, and finds all unique combinations, filling in explicit NAs where necessary.
Output:
 year cases country population
 <dbl> <dbl> <chr> <dbl>
 1 1999 745 Afghanistan 19987071
 2 1999 2666 NA NA
 3 1999 37737 Brazil 172006362
 4 1999 80488 China NA
 5 1999 212258 NA NA
 6 2000 745 NA NA
 7 2000 2666 Afghanistan 20595360
 8 2000 37737 NA NA
 9 2000 80488 NA NA
10 2000 212258 China 1280428583
fill in those missing values with fill(). Replaces missing values with the most recent non-missing value (sometimes called the last observation carried forward).
Output:
 person treatment response
 <chr> <dbl> <dbl>
1 Gautam 1 7
2 Gautam 2 10
3 Gautam 3 9
4 heema 1 4