Pearson correlation is a parametric statistical method used to measure the linear relationship between two continuous variables. It indicates both the strength and direction of the relationship and returns a value between -1 and +1. In R Programming Language it is used to analyze the association between two normally distributed variables.
There are mainly two types of correlation:
Parametric Correlation: It measures a linear dependence between two variables (x and y) is known as a parametric correlation test because it depends on the distribution of the data.
Non-Parametric Correlation: They are rank-based correlation coefficients and are known as non-parametric correlation.
Pearson Correlation Formula:
Parameters:
: pearson correlation coefficient
and : two vectors of length n
and : corresponds to the means of x and y, respectively.
Implementation of Pearson Correlation Testing
We implement Pearson correlation testing in R using two primary functions:
1. Calculating the Correlation Coefficient Using cor()
We calculate the Pearson correlation coefficient between two numeric vectors using the cor() function.
cor: Computes the correlation coefficient between two numeric vectors.
x, y: Input numeric vectors of the same length.
method: Specifies the correlation method to be used (here, it is "pearson").
cat: Used to concatenate and print values.
Output:
Pearson correlation coefficient is: 0.5357143
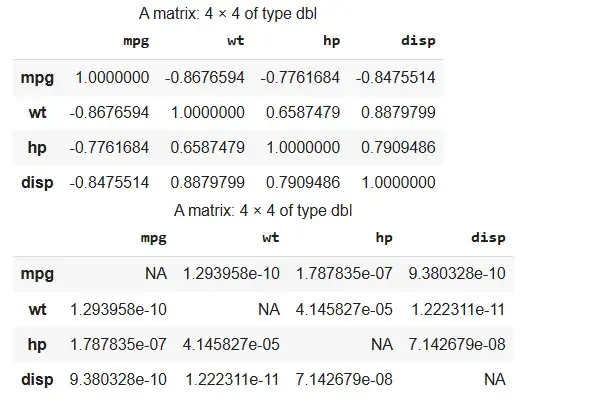
2. Performing Correlation Test Using cor.test()
We perform the Pearson correlation test which returns the coefficient, p-value and confidence interval.
cor.test: Performs a test of association between paired samples.
t: Test statistic used to calculate the p-value.
p-value: Indicates the probability of observing the data under the null hypothesis.
alternative hypothesis: States the direction of the correlation (not equal to zero by default).
sample estimates: Returns the computed correlation coefficient.
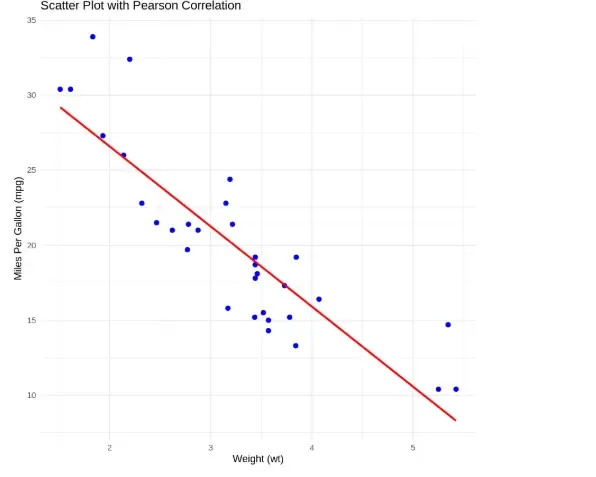
The scatter plot shows a strong negative correlation between weight and mileage, where heavier cars tend to have lower miles per gallon, as indicated by the downward-sloping red regression line
