 |
VOOZH | about |
|
VOOZH | about |
A Cumulative Distribution Function (CDF) represents the probability that a random variable takes a value less than or equal to a given number. It helps understand how values in a dataset accumulate over a range.
Syntax:
ecdf( data_vector )
Parameter:
To plot a CDF in R programming language, we first calculate it using the ecdf() function and then display it using the plot() function.
Syntax:
plot(CDF)
Parameter:
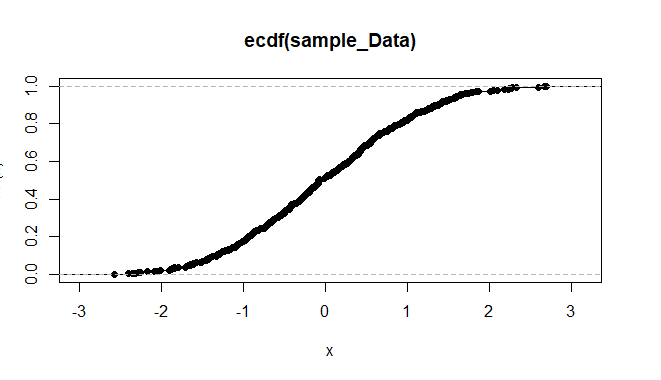
Example 1: We plot the CDF of 500 random numbers
Output:
Example 2: We plot the CDF of Petal.Length from the iris dataset
Output:
To plot the CDF of a standard distribution, we use the curve() function along with a probability function like pnorm.
Syntax:
curve( expression, from, to )
Parameters:
Example: We plot the CDF of a normal distribution from -10 to 10.
Output:
We can also use the ggplot2 package to create styled CDF plots using stat_function().
Syntax:
plot + stat_function( fun )
Parameters:
Example: We create a CDF plot for the normal distribution using ggplot2.
Output:
This plot displays the cumulative distribution function of a normal distribution using ggplot2, with a styled curve, custom labels and a minimal visual theme.