 |
VOOZH | about |
|
VOOZH | about |
Plotting a shaded area between vertical lines means to put a vertical rectangle on a different color plot as compared to the rest of the plot area. We create this rectangle depending on the conditional values of the x-axis and represent the pivot area on the basis of characteristics of the data. This can be obtained using R and is described how in his article.
Syntax:
geom_rect(xmin, xmax, ymin, ymax, size, linetype, color, fill, alpha)
Syntax:
geom_vline(xintercept, size, linetype, color, alpha)
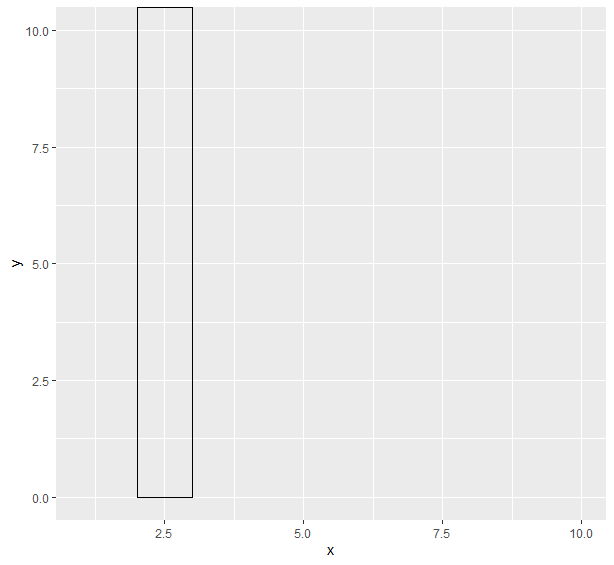
Program 1: Draw two vertical files
Output:
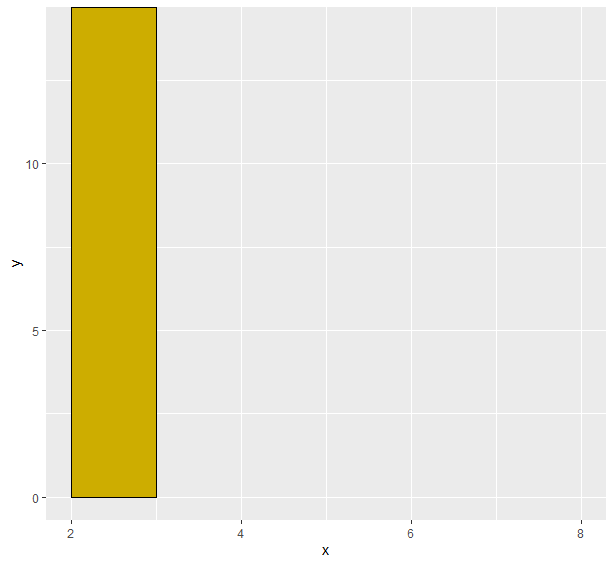
👁 ImageProgram 2: Fill color between lines
Output:
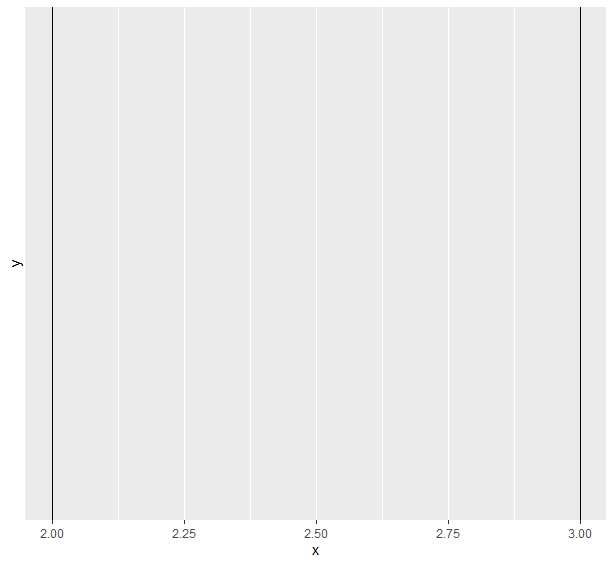
👁 ImageProgram 1: Drawing two lines
Output:
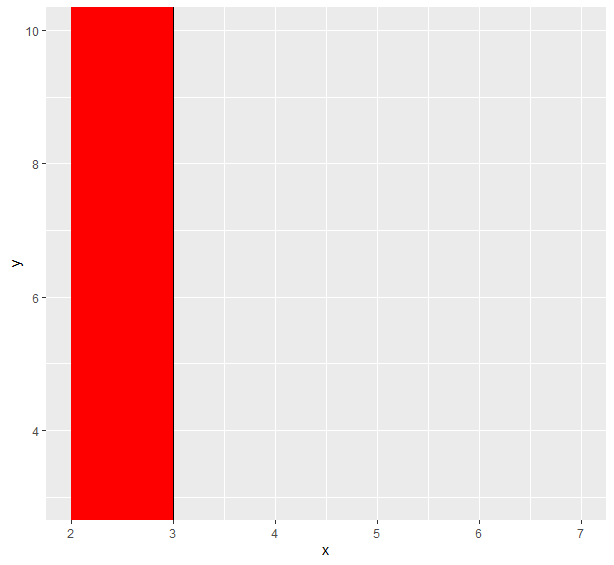
👁 ImageProgram 2: Fill color between these lines
Output:
👁 Image