 |
VOOZH | about |
|
VOOZH | about |
R Markdown is a powerful tool for combining text, code, and visualizations into a single document. It is widely used for creating reports, presentations, and documentation that include both R code and its output. One of the common tasks in R Markdown is to generate multiple plots within a loop. This article explains how to output plots within a for loop in an R Markdown document using the knitr package.
R Markdown is an extension of Markdown that supports embedding R code chunks within text documents. When you knit the document, the R code is executed, and the results, including plots, are embedded directly into the document. The knitr package is the engine behind this process, enabling the integration of R with Markdown.
When working in R Markdown, generating multiple plots inside a loop can be challenging due to how knitr handles plot outputs. Typically, R Markdown captures the output of each code chunk as a whole. Therefore, if multiple plots are generated inside a loop, only the last plot might appear in the output, unless special steps are taken.
To ensure that all plots within a for loop are rendered in the final document, follow these steps:
print() Function: Inside a for loop, each plot needs to be explicitly printed using the print() function. This ensures that knitr captures each plot separately.fig.keep = "all" to keep all plots generated within the chunk.Below is a step-by-step example of how to output multiple plots from a for loop in an R Markdown document using R Programming Language.
Begin by setting up a basic R Markdown document.
---
title: "Plotting within a For Loop in R Markdown"
author: "Your Name"
date: "2024-08-29"
output: html_document
---

```{r setup, include=FALSE}
knitr::opts_chunk$set(echo = TRUE)
Next, write a `for` loop that generates multiple plots. Each plot will be printed inside the loop.
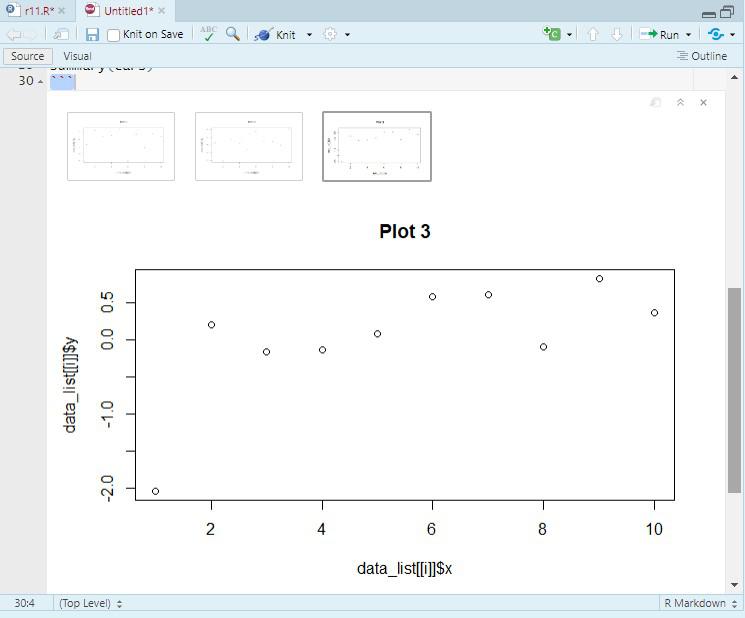
Output:
To ensure that all plots are displayed, we need to use the `print()` function inside the loop. This explicitly tells knitr to render each plot during the loop iteration.
The `print()` function forces the plot to be rendered and displayed in the output document. This is essential when working inside loops or custom functions where knitr might not automatically display the plot.
Let’s extend the example to customize the appearance of the plots using `ggplot2`, a popular R package for creating complex and customizable graphics.
Output:
Outputting plots within a `for` loop in R knitr Markdown requires explicit printing to ensure that each plot is rendered in the final document. By following the examples and best practices outlined in this article, you can effectively generate dynamic reports with multiple plots in R Markdown. This technique is especially useful in data analysis and reporting scenarios where you need to visualize patterns across different subsets of data, iterate over different parameters, or present a series of visual results in a structured document.