 |
VOOZH | about |
|
VOOZH | about |
When working with data visualization in R using the ggplot2 package, there are times when you need to display multiple plots on the same page or grid. This is useful when you want to compare different plots or display multiple visualizations in a report or presentation. R offers several ways to achieve this, such as using gridExtra, cowplot, or patchwork packages. In this article, we will explore different methods for showing multiple ggplot2 plots on one page using R Programming Language.
Before starting, ensure you have the necessary packages installed. You can install the required packages with the following commands:
# Install ggplot2 and supporting packages if not installed
install.packages("ggplot2")
install.packages("gridExtra")
install.packages("cowplot")
install.packages("patchwork")

library(ggplot2)
library(gridExtra)
library(cowplot)
library(patchwork)
Let's create a few simple ggplot2 plots that we will later combine onto one page:
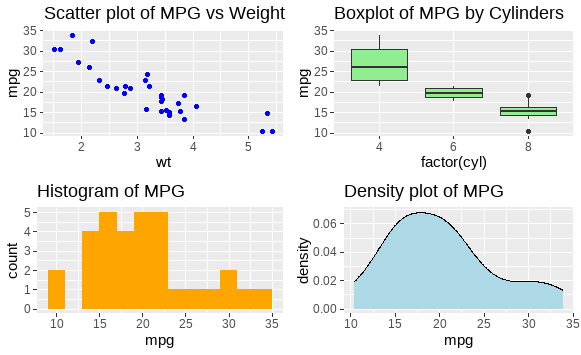
gridExtra::grid.arrange()The gridExtra package provides the grid.arrange() function, which can be used to arrange multiple ggplot2 plots on the same page.
Output:
You can also adjust the number of rows and columns to display the plots in different configurations.
Output:
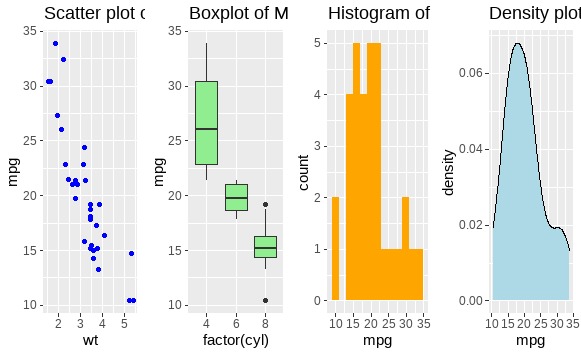
cowplot::plot_grid()The cowplot package is specifically designed for arranging ggplot2 plots. It provides more flexibility, including aligning plots, scaling, and adding annotations.
Output:
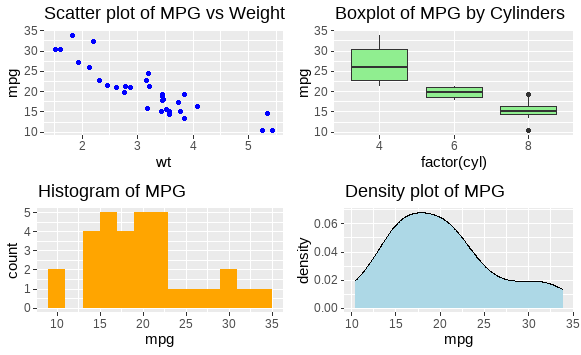
patchworkpatchwork is another package that simplifies combining multiple ggplot2 plots. It uses a simple intuitive syntax for arranging plots.
Output:
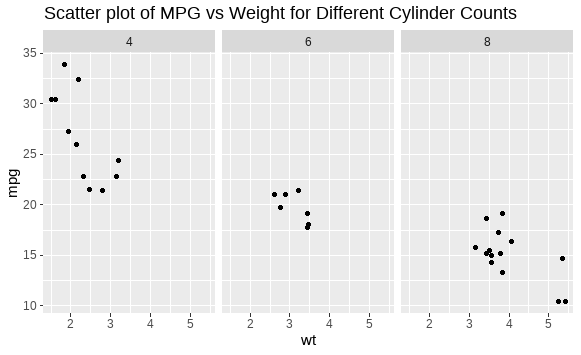
facet_wrap() or facet_grid()If your plots share the same x and y axes, you can use facet_wrap() or facet_grid() to display multiple plots. This is useful when visualizing multiple subsets of the same data.
Output:
Displaying multiple plots on one page in R using ggplot2 can be achieved in several ways, depending on the level of customization you need. The methods discussed here – gridExtra::grid.arrange(), cowplot::plot_grid(), and patchwork – provide versatile solutions for arranging and combining plots. You can choose the method that best fits your requirements based on ease of use and flexibility.