 |
VOOZH | about |
|
VOOZH | about |
The survey package in R is designed to handle complex survey data. It accounts for survey design features such as stratification, clustering, and weighting. This package is ideal for analyzing data from large-scale surveys, like health studies or social surveys.
svydesign): Represents the survey's design, including sampling weights, clusters, and stratification.The survey package is commonly used in social and health sciences for analyzing complex survey data, but it has limitations:
We will implement the use of Survey Package in R programming language.
We are loading the survey package with library(survey), which is used for handling complex survey data. Next, we load the api dataset using data(api), which contains information about California school districts. We then create a survey design object, api_design, using the svydesign() function, defining the survey's structure. We calculate the weighted mean of the enroll variable using svymean(), and specify the survey design object with design = api_design to apply the survey weights and account for the survey’s structure.
Output:
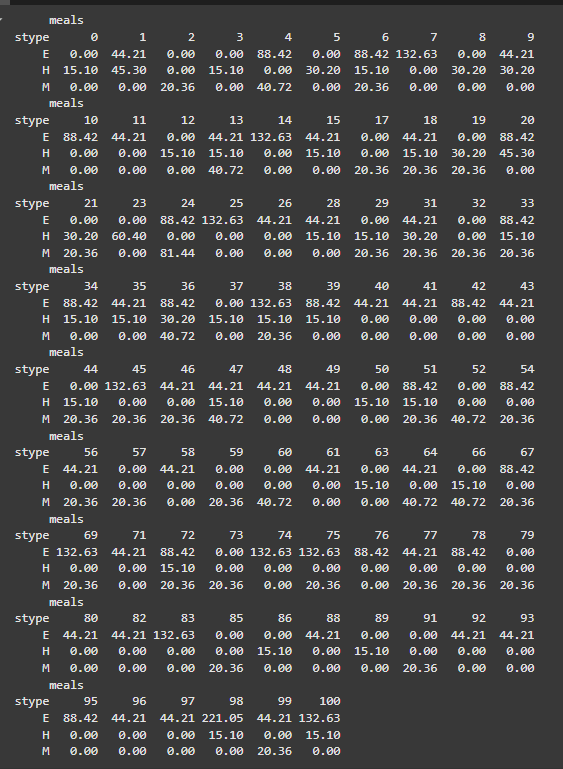
We are using the svytable() function to create a survey table that cross-tabulates the stype and meals variables from the survey data. The design = api_design argument applies the survey design object api_design, ensuring that the table accounts for the survey's weights and complex design. This function gives a weighted count of how the variables stype (school type) and meals (meals served) are distributed in the dataset.
Output:
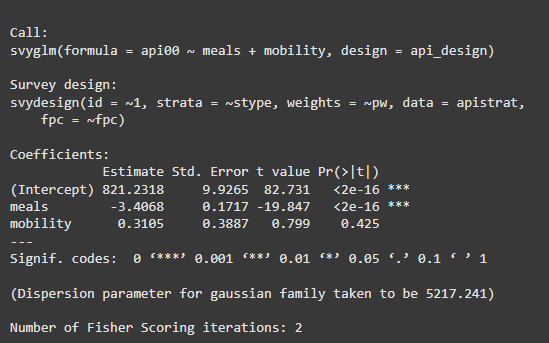
We are building a weighted linear model using the svyglm() function and summarising it using the summary() function.
Output:
We are using the predict function with our fitted model (model) and specifying the dataset (apistrat) for which we want to make predictions. we can use the head function to view the first few predicted values.
Output:
We are using the ggplot2 package to create a scatter plot comparing the Actual and Predicted values from the prediction_data data frame. We first create the data frame containing the actual and predicted values. Then, we use ggplot() to plot Actual values on the x-axis and Predicted values on the y-axis. We add points to the plot with geom_point() and fit a linear regression line using geom_smooth(), setting it to blue and removing the confidence interval (se = FALSE). Finally, we use labs() to label the axes and add a title to the plot.
Output:
In this article, we explored the survey package in R, which is used for analyzing complex survey data.