 |
VOOZH | about |
|
VOOZH | about |
Customer churn is an important concern for the telecom industry, as retaining customers is just as important as acquiring new ones. In this article we will be analyzing a dataset related to customer churn to derive insights into why customers leave and what can be done to retain them.
The primary goal of this project is to understand the factors that influence customer churn in the telecom industry. By identifying these factors, telecom companies can implement targeted interventions to retain customers. This has broader implications, helping telecom companies improve profitability, customer satisfaction and community stability through reliable services.
The dataset contains columns such as customer ID, gender, senior citizen, Partner, Dependents, tenure, phone service, Internet service, Churn and other telecom customer-related information.
Dataset Link: Telecom Customer Churn
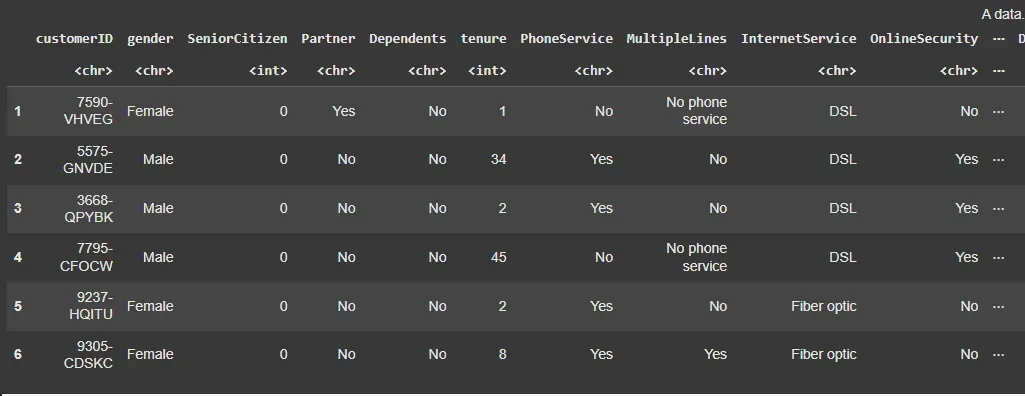
In this step, we will load the necessary libraries and read the dataset. We will check the first few rows of the data to understand its structure. The head(churn_data) function in R displays the first six rows of the "churn_data" dataframe. This function is useful for quickly inspecting the structure and contents of the dataframe to understand what kind of data it contains.
Output:
From this initial glance, we can see that the dataset contains both categorical and numerical data, such as customer information, service types and billing methods. This forms the basis for understanding patterns related to customer churn.
EDA is a process of describing and summarizing data to bring important aspects into focus for further analysis.
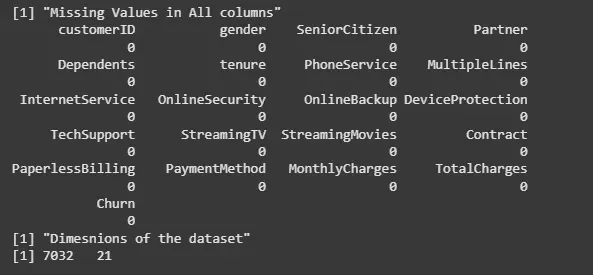
We begin by checking for missing values and printing the dimensions of the dataset.
Output:
We can see that no column has missing data. This step is important for ensuring the quality of our analysis. We can also conclude that our dataset has 7032 rows and 21 columns.
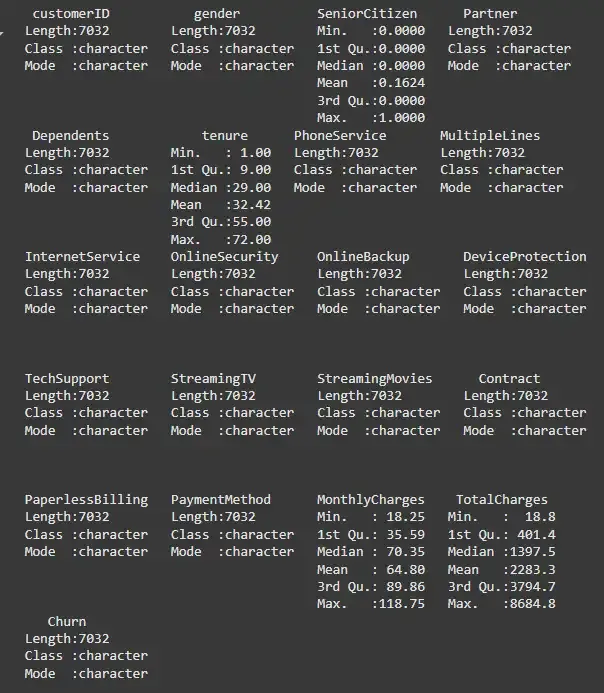
The summary() function in R provides a statistical summary of each column in the dataframe. For numeric columns, it shows the minimum, 1st quartile, median, mean, 3rd quartile and maximum values. For categorical columns, it displays the frequency of each category.
Output:
This analysis helped us understand the distribution and key statistics of our data.
We will visualize the churn distribution and explore how various factors such as contract type, tenure and internet service affect churn.
We will be plotting a bar chart to display the distribution of customer churn.
Output:
The pie chart shows the distribution of churn (whether a customer left or stayed). It helps us see the proportion of customers who churned versus those who didn’t.
This bar plot shows how churn varies with respect to contract type (Month-to-month, One year, Two year).
Output:
The bar chart here helps visualize whether different contract types (Month-to-month, One year and Two year) have an impact on customer churn. It uses side-by-side bars to make the comparison clear.
This bar chart shows the churn distribution in relation to the tenure (number of months a customer has been with the telecom company).
Output:
This visualization helps us understand how the number of months a customer has been with the telecom company correlates with the likelihood of churn.
This bar plot shows the churn distribution in relation to the type of internet service used (DSL or Fiber optic).
Output:
This bar chart helps visualize whether the type of internet service (DSL vs. Fiber optic) impacts the churn rate.
Identifying the number of senior citizens helps in tailoring services and promotions specifically for this segment. This bar plot compares the churn distribution between senior citizens and non-senior citizens.
Output:
This bar chart shows the number of senior citizens vs. non-senior citizens in the dataset, helping to tailor services specifically for this segment.
Understanding how customers prefer to pay for services can inform billing and payment strategy. This bar plot shows the distribution of different payment methods used by customers.
Output:
This bar chart visualizes the preferred payment methods among customers, helping telecom companies better understand customer behavior and billing preferences.
From our analysis, we observed that:
By addressing these factors, telecom companies can implement more effective retention strategies to reduce churn.