 |
VOOZH | about |
|
VOOZH | about |
In this article, we will discuss how to change the look of a plot theme (background color, panel background color, and gridlines) using the R Programming Language and ggplot2 package.
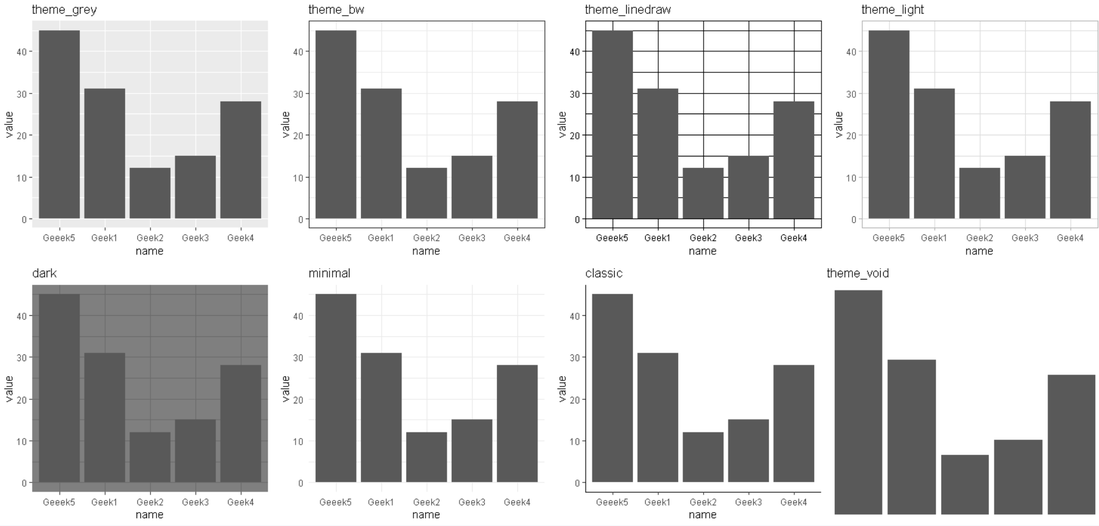
The ggplot2 package in R Language has 8 built-in themes. To use these themes we just need to add that theme function to the plot. These functions change the look and feel of a plot by manipulating three key aspects of the plot that are background color, panel background color, and gridlines
Syntax: plot + theme_function()
Here, are the following 8 prebuilt themes in the ggplot2 package in R Language:
Example:
A Simple bar plot with all 8 themes combined using the grid.arrange function of gridExtra package.
Output:
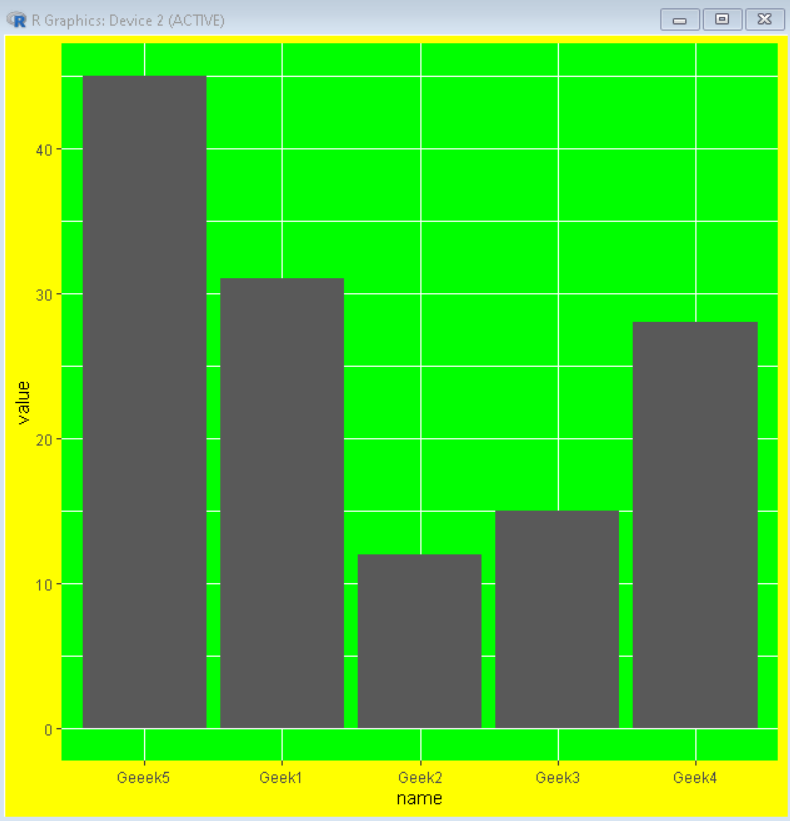
👁 ImageTo create a manual theme for users' liking, we can change the background color of the panel as well as plot using the panel.background and plot.background argument of the theme function of the ggplot2 package.
Syntax: plot + theme(plot.background = element_rect( fill ) , panel.background = element_rect( fill ) )
Example:
Here, is a bar plot with a green panel background and yellow plot background color.
Output:
👁 Image