 |
VOOZH | about |
|
VOOZH | about |
Time Series Analysis using Facebook Prophet in R is a method of analyzing and forecasting data that changes over time. It allows businesses to understand patterns in time series datasets and make future predictions using trend, seasonality, and holiday effects. R provides support for Prophet via the prophet package, which makes implementation simple and interpretable.
Time series analysis involves studying data points collected in time order to detect patterns, trends, and seasonality, helping in making informed predictions based on historical behavior. In R, this can be done using the ts() function, which transforms numeric data into a time series object.
Facebook Prophet is a forecasting model developed by Facebook, designed to fit decomposable time series data using three main components: trend, seasonality, and holidays. It provides better control, automatic tuning, and interpretable output compared to traditional models like ARIMA.
The model is defined as:
Where:
1. Trend: A trend is a shift in development either in increment or decrement direction. Mathematically,
Where:
2. Seasonality: Seasonality is a feature of time series object that occurs at a particular time/season and changes the trend.
3. Holidays: Holidays are a time period that changes a lot to the business. It can make a profit or loss depending upon the business.
We use the built-in AirPassengers dataset in R to forecast future airline passenger traffic using the Facebook Prophet model. This implementation includes data preparation, model fitting, and visualization of forecast results.
We install the prophet package to use Prophet functions for time series modeling and forecasting.
We load the Prophet package to access its forecasting functions.
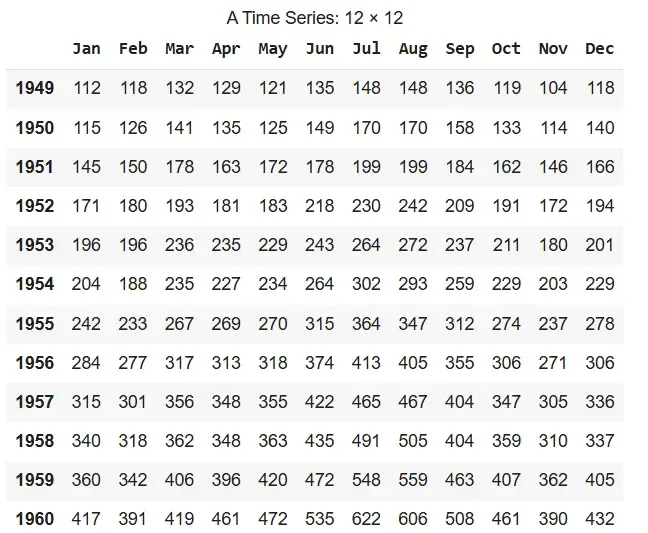
We load the built-in AirPassengers dataset and assign it to a new variable.
We examine the built-in AirPassengers data to understand its structure.
Output:
We check the total number of time periods (months) in the series.
Output:
144
We convert the time series object into a data frame with columns ds and y.
We fit the Prophet model to the prepared dataset.
We generate future timestamps and use the model to forecast values.
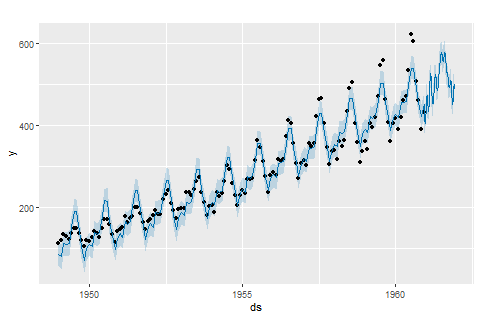
We visualize the forecasted values with the historical data.
Output:
👁 output-graphThe forecast plot displays the historical airline passenger data (black dots), the predicted trend (dark blue line), and the confidence intervals (shaded blue area) for the next 12 months.