 |
VOOZH | about |
|
VOOZH | about |
A time series is the series of data points listed in the order timeline i.e. one of the axes in the form of dates, years or months.
Time-series analysis consists of methods for analyzing time-series data in a way to retrieve some meaningful insight from data. It is useful in many industries like financial industries, pharmaceuticals, social media companies, web service providers, research and many more as it helps to predict future events based on trends of past data.
To better understand our data, we need effective tools to visualize it. The R programming language offers set of visualization tools through the ggplot2 package.
We can use the geom_line() function to visualize the time-series data using a line plot.
ggplot(dataframe , aes(x, y)) + geom_line()
Parameter:
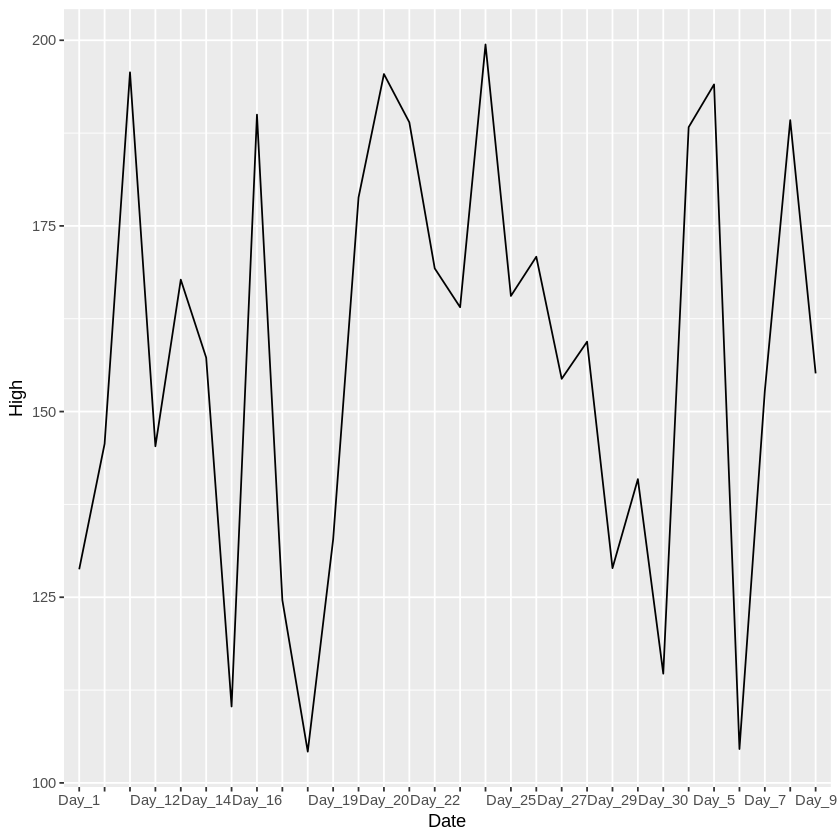
Example: A basic line chart depicting time series data.
Output:
Since one of the axis data is in the form of date, we can format it in multiple forms of date. We can use the scale_x_date() function to choose the format displayed on the X-axis.
scale_x_date(date_labels = date-format-identifiers)
Here, date format identifiers are:
| Identifiers | Explanation | Example |
|---|---|---|
| %d | day as a number | 21 |
| %a | short-form weekday | Mon |
| %A | long-form weekday | Monday |
| %m | month as number | 10 |
| %b | short-form month | Oct |
| %B | long-form month | October |
| %y | 2 digit year | 21 |
| %Y | 4 digit year | 2021 |
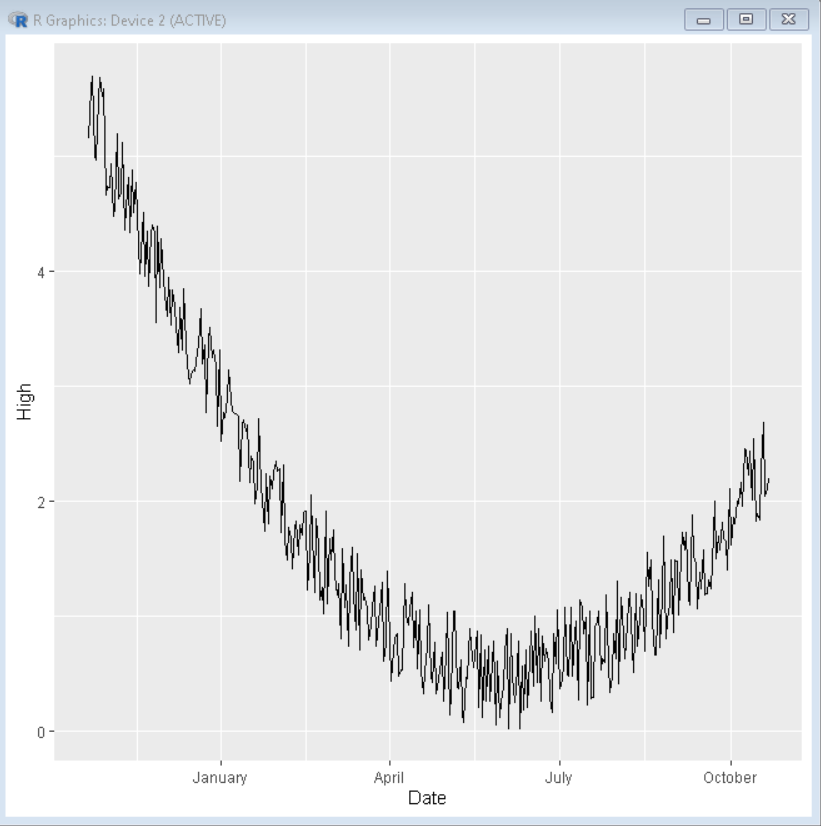
Example: A time series using data label identifier to display only month in long-form.
Output:
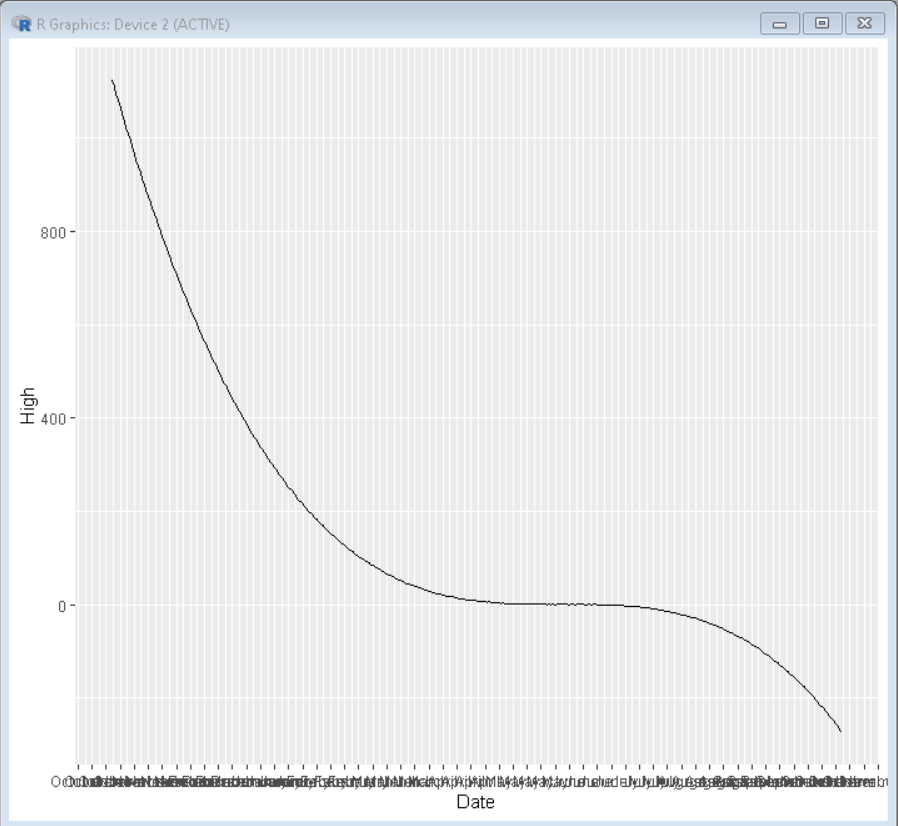
👁 ImageWe can create different breakpoints by using minor or major breaks in the plot using the date_breaks and date_minor_breaks argument of the scale_x_date() function of ggplot2.
scale_x_date(date_breaks, date_minor_breaks)
Example: A basic time series plot with manual date breaks and minor date breaks.
Output:
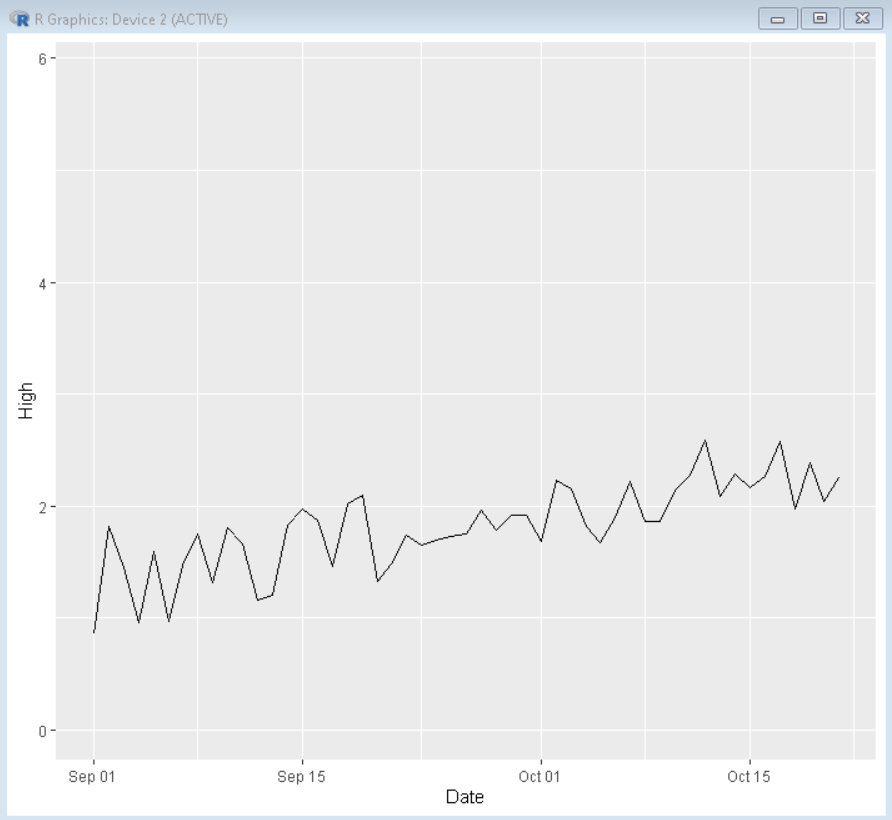
👁 ImageWhile dealing with large datasets, we might need to focus on a small time frame. To do so we use the limit option of the scale_x_date() function to select a time frame in the data.
scale_x_date(limit)
Example: A plot with limited data from October 2021 to July 2021.
Output:
👁 ImageIn this article, we discussed time-series visualization with the ggplot2 package in the R programming Language.