 |
VOOZH | about |
|
VOOZH | about |
When creating plots with ggplot2 in R, you often encounter cases where the legend text is too long, causing it to overlap with other elements or extend beyond the plot area. This can make the plot look cluttered and difficult to interpret. To address this issue, you can wrap the legend text to fit within a specific width, ensuring that your plots remain clean and visually appealing.
Long legend text can cause the following issues:
Wrapping the text solves these issues, making the legend more legible and ensuring that your plot remains clear and well-organized in R Programming Language.
Make sure you have the necessary libraries installed. We'll use ggplot2 for plotting and stringr for manipulating text.
# Install required packages
install.packages("ggplot2")
install.packages("stringr")

# Load the libraries
library(ggplot2)
library(stringr)
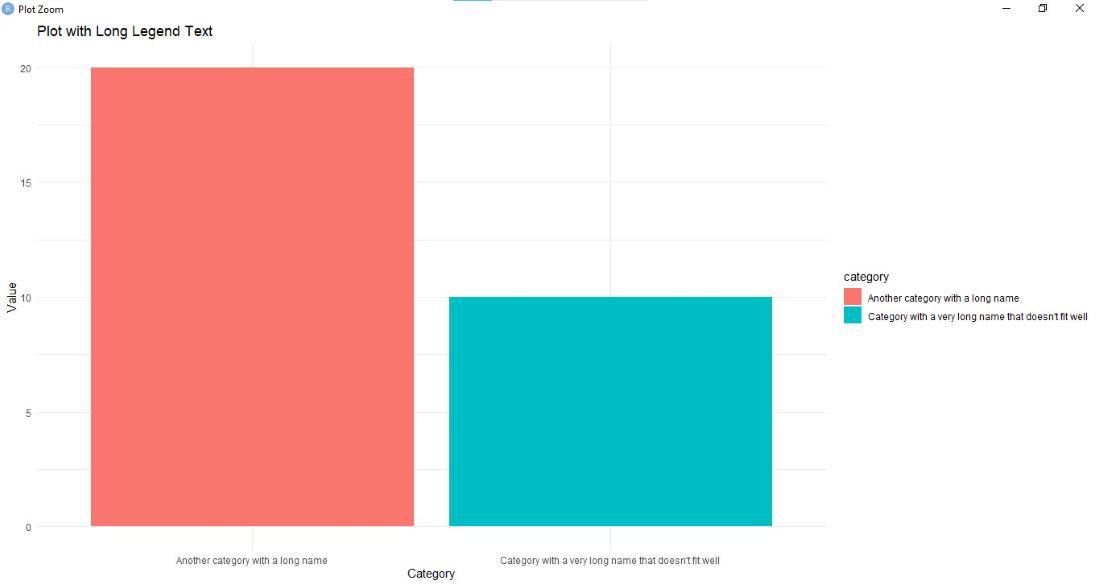
Let's create a simple plot with a long legend label to explain the problem.
Output:
In this example, you'll notice that the legend text is long and extends beyond the plot area. This makes the plot look unprofessional and hard to read.
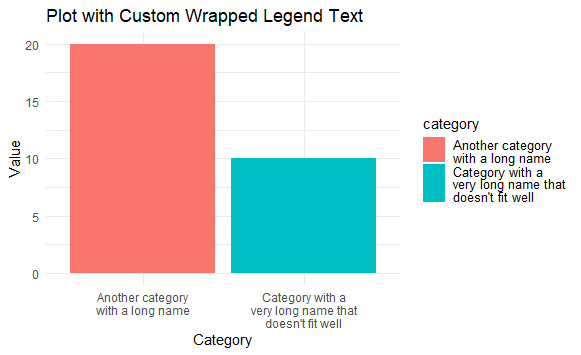
stringr to Wrap Legend TextWe can use the str_wrap() function from the stringr package to wrap the legend text into multiple lines.
Output:
In this example, str_wrap() sets the width of the text to 20 characters, ensuring that the legend text wraps into multiple lines if it exceeds this limit.
guides()You can use guides() with guide_legend() to adjust the width of the legend text directly.
Output:
lineheight: Adjusts the spacing between lines in the legend text, making it wrap more neatly.
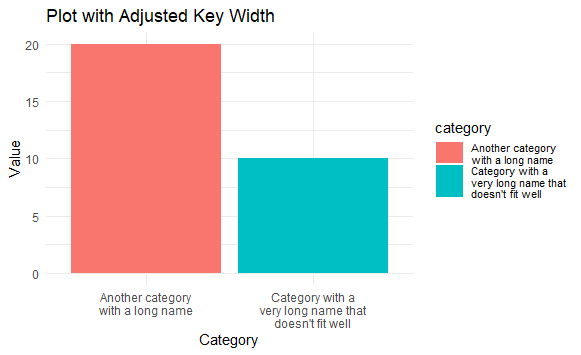
guide_legend()Another effective way to wrap legend text is to adjust the keywidth parameter using guide_legend() to control the width of the legend keys.
Output:
keywidth: Adjusts the width of the legend keys, allowing the legend text to fit neatly within the allocated space.
Wrapping legend text is essential for improving the readability and overall appearance of your ggplot2 visualizations in R. By using methods such as str_wrap() from the stringr package, customizing with guides(), or adjusting the legend width, you can effectively handle long legend text and ensure that your plots remain clear and visually appealing.