 |
VOOZH | about |
|
VOOZH | about |
Z test is a popular parametric test used for hypothesis testing. It assumes that the data follows a normal distribution and relies on known population parameters such as the mean and standard deviation. The Z-test helps determine if there is a significant difference between the sample mean and the population mean or between the means of two samples. It is particularly useful when dealing with large sample sizes (typically greater than 30) and the population standard deviation is known.
The Z-value serves as a threshold to decide whether to accept or reject the hypothesis. There are two main types of Z-tests:
The Z-test follows a normal distribution and is commonly used when the sample size is large and the data meets parametric assumptions.
Here Test is applicable on one sample that has been taken from the population. The formula is as follows:
Here,
Here Z Test is applicable on two samples that has been taken from the population. The formula is as follows:
Here,
The Z-test is commonly applied in the following situations:
The Z-test is used when we know the population's standard deviation and are comparing a sample mean to the population mean or comparing the means of two independent samples. For example, if the average height of a population is known, the Z-test can be used to determine whether a sample of individuals has a significantly different average height.
The Z-test is most reliable when working with large sample sizes, typically when n>30n > 30. As the sample size increases, the sampling distribution of the sample mean approximates a normal distribution (Central Limit Theorem), making the Z-test a suitable choice for larger samples.
We can Implement the Z-test in R using the BSDA library. We can install and load this library in R using the install.packages() and library() function.
The syntax of z- test in R is:
z.test(x, y, alternative='two.sided', mu=0, sigma.x=NULL, sigma.y=NULL,conf.level=.95)
Where:
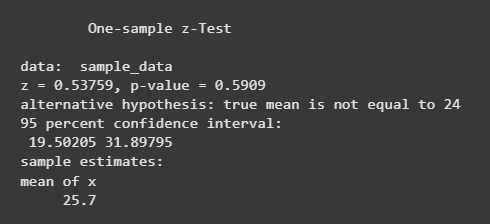
We are loading the BSDA package, which provides statistical functions like z.test() for performing Z-tests. We then create a sample dataset (sample_data) containing 10 data points, representing a sample from a population. Next, we conduct a one-sample Z-test using the z.test() function, where we compare the sample mean against a hypothesized population mean (24) and we use a known population standard deviation of 10. Finally, we print the results of the Z-test, which include the test statistic, p-value and other statistical information to assess whether the sample mean significantly differs from the hypothesized population mean.
Output:
We can see that:
Therefore ,there’s no strong evidence to suggest that the sample mean significantly differs from the population mean of 24.
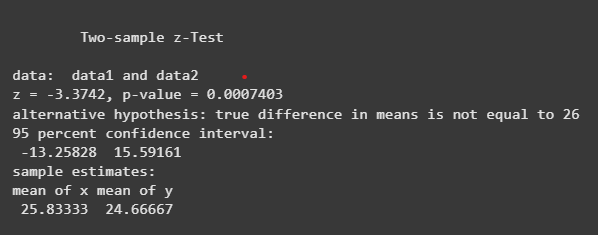
We are performing a one-sample Z-test to compare the sample mean of the dataset (sample_data) with the hypothesized population mean (24). We use the z.test() function from the BSDA package, specifying the population standard deviation (sigma.x = 10). The output provides the Z-test statistic, p-value, 95% confidence interval for the true mean and the sample mean. Based on the p-value, we determine whether the difference between the sample and population means is statistically significant.
Output:
We can see that:
data1 is 25.83 and the mean of data2 is 24.67.Therefore, the difference between the two sample means is statistically significant and not equal to 26.
In this article, we explored the Z-test in R, including how to perform one-sample and two-sample Z-tests, interpret the results and determine statistical significance.