 |
VOOZH | about |
|
VOOZH | about |
In R, the lines() function is called to add on top of already existing plot. This is particularly helpful when you want to add more lines, such as trend lines, regression lines, or special lines, on a plot. The lines() function allows flexibility in line color, line width, and line type, with multiple choices for customizing your plot.
Syntax:
lines(x, y, col, lwd, lty)
Parameters:
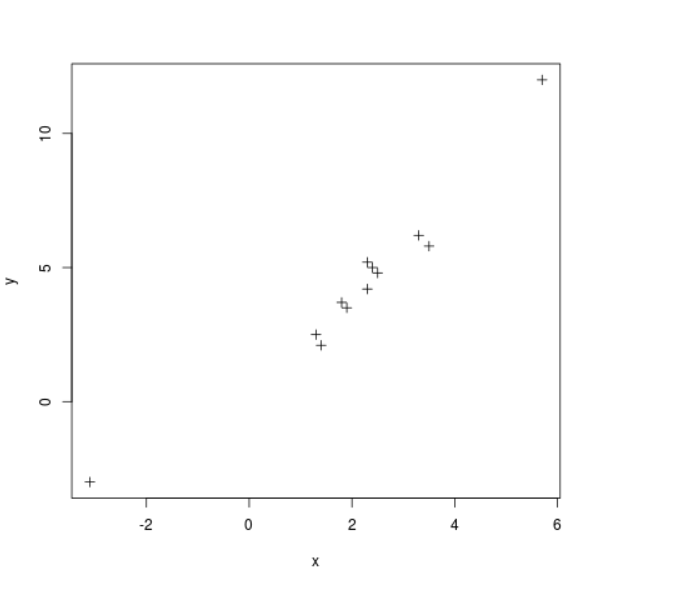
Here we are going to create a scatter plot using the dataset.
Output:
We will here begin by generating a scatter plot and then adding points connected with lines using the function lines().
Output:
Here we will make a scatter plot and then we will draw lines with lines() function
Output:
In other situations, you might prefer adding vertical or horizontal lines to the plot without calling lines(). The abline() function is helpful for drawing horizontal, vertical, or diagonal lines to the plot.
Output
Related Articles: