 |
VOOZH | about |
|
VOOZH | about |
Exponential Smoothing is a time series forecasting method that predicts future values by assigning exponentially decreasing weights to past observations. In this approach, recent data points have a greater influence on the forecast while the impact of older observations gradually decreases over time. In R programming, exponential smoothing can be used to analyze and forecast time series data such as sales trends, stock prices, demand patterns and production levels.
Here, we see different types of exponential smoothing techniques.
Simple Exponential Smoothing (SES) is a forecasting method used for time series data that has no trend or seasonal pattern. It smooths the data by giving more weight to recent observations and less weight to older ones. The method uses a smoothing parameter (0–1) to control how quickly past values lose influence.
Mathematical Representation of SES
where
Here we implement Simple Exponential Smoothing on the Google stock price dataset (goog). This technique is ideal for time series data without trend or seasonality, assigning more weight to recent observations for better short-term forecasting.
Step 1: Installing and loading the required packages
We install the required packages using the install.packages() function.
Step 2: Loading the required packages
We load the installed packages into the R environment using library() function.
Step 3: Splitting the dataset into training and testing sets
We split the Google stock data (goog) into a training set and a test set using window().
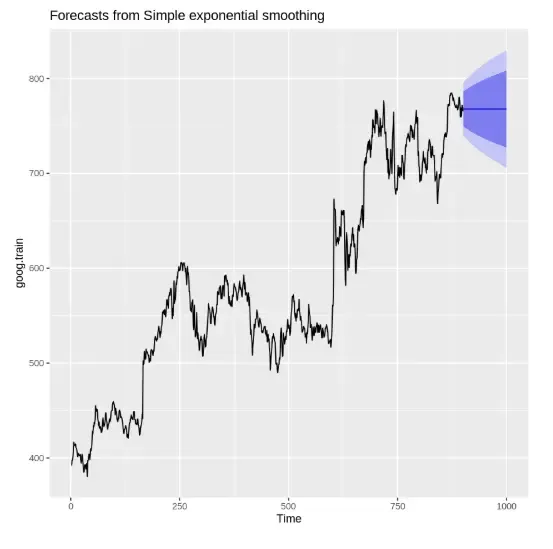
Step 4: Performing SES on training data
We apply the ses() function with alpha = 0.2 and forecast horizon h = 100.
Output:
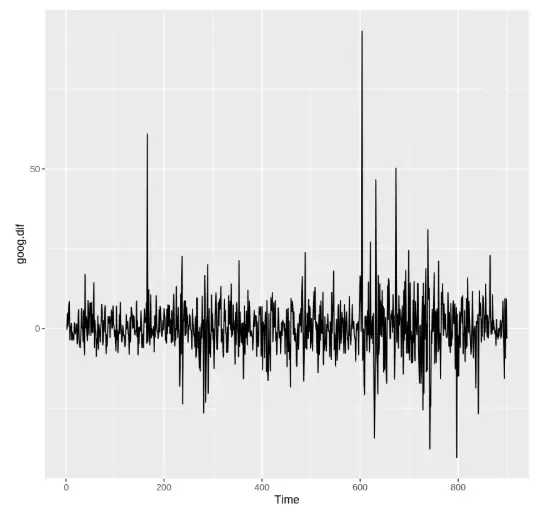
Step 5: Removing trend and reapplying SES
We use diff() to remove trend and then reapply SES.
Output:
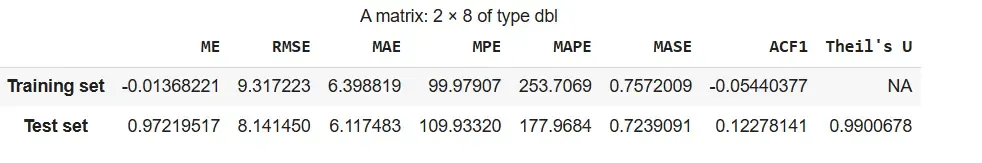
Step 6: Evaluating the model performance
We difference the test set and evaluate accuracy using accuracy(). It evaluates model performance using metrics like RMSE, MAE.
Output:
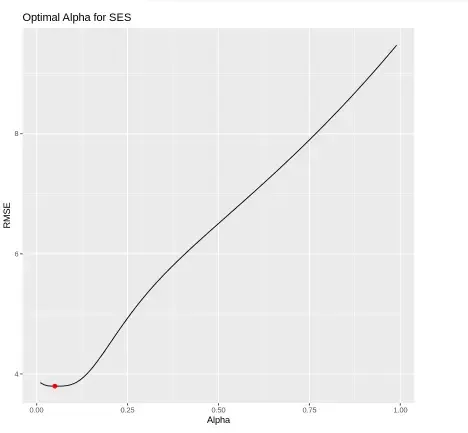
Step 7: Finding the optimal alpha value
We test multiple alpha values from 0.01 to 0.99 and record RMSE for each.
Output:
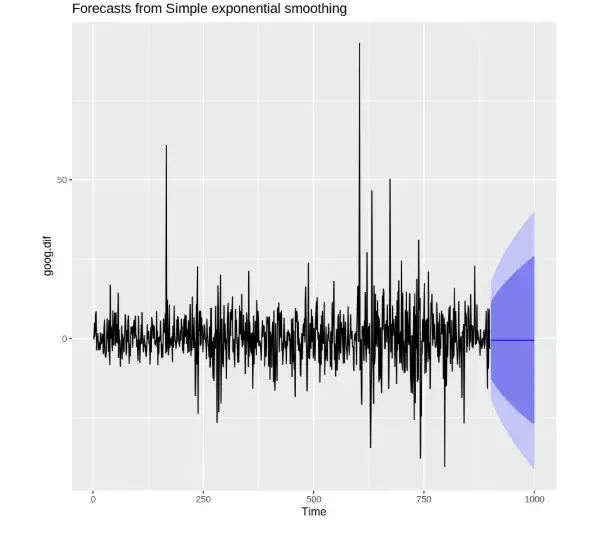
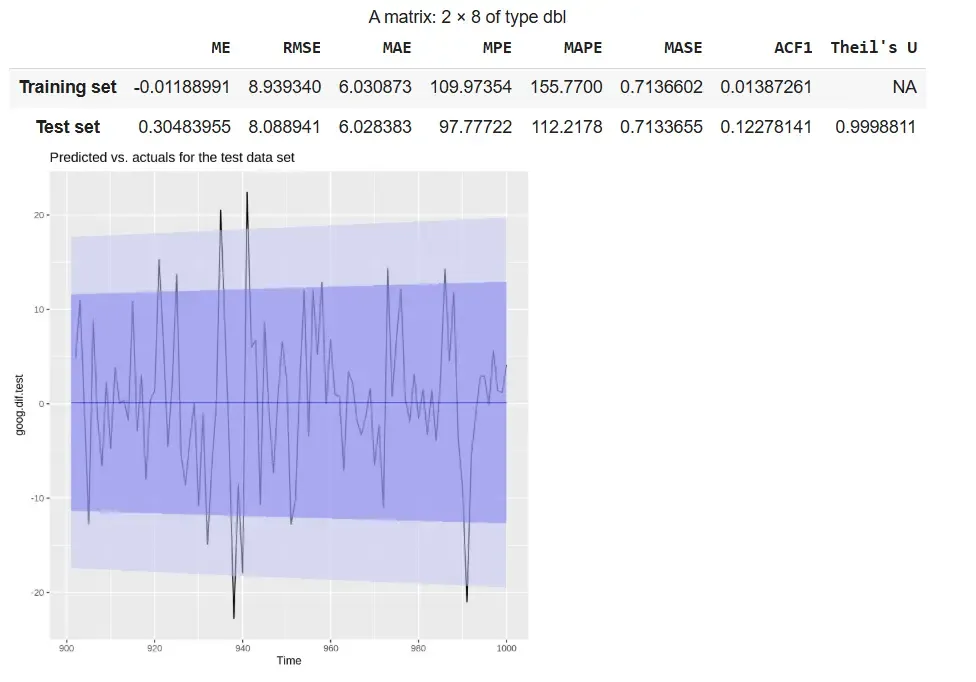
Step 8: Re-fitting SES with optimal alpha and visualizing predictions
We re-fit the SES model using the optimal alpha = 0.05 and compare the predicted values with the actual test data using a line plot.
Output:
The output shows that the refitted SES model with alpha = 0.05 demonstrates stable performance, with RMSE and MAE values being similar across training and test sets. The plot indicates that the forecast follows the overall pattern of the actual differenced data within the confidence intervals.
While Simple Exponential Smoothing (SES) works well for data without trend, it cannot account for long-term trends in a time series. Holt's Method, also known as Double Exponential Smoothing, extends SES by incorporating a trend component, making it suitable for datasets that exhibit a trend but no seasonality.
This method uses two smoothing parameters:
Holt’s Method allows forecasting both the current level and the trend, providing more accurate predictions for trending time series data. At each time step, the level and trend are updated recursively as:
The forecast for h periods ahead is then:
where
We will implement Holt’s Method in R to forecast time series data that contains a trend but no seasonality. Unlike Simple Exponential Smoothing (SES), Holt’s Method uses two parameters: alpha for level and beta for trend to adapt to upward or downward movements in the data.
Step 1: Installing the required packages
We install the required packages to access built-in time series datasets and forecasting functions.
Step 2: Loading the required packages
We will load the necessary libraries.
Step 3: Creating training and testing datasets
We split the goog dataset into training and test sets using window(). It used to extract specific time segments from a time series.
Step 4: Finding the optimal beta value
We loop through beta values from 0.0001 to 0.5 to find the value that minimizes RMSE on the test set.
Output:
The plot shows RMSE against beta values, highlighting the optimal beta (~0.0601) that minimizes forecasting error in Holt’s method.
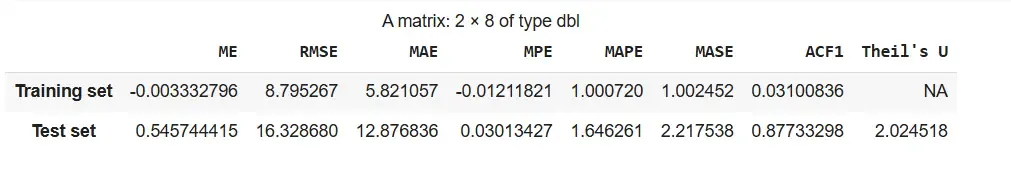
Step 5: Applying Holt’s method and checking accuracy
We apply Holt’s method using the default parameters and measure the model’s performance.
Output:
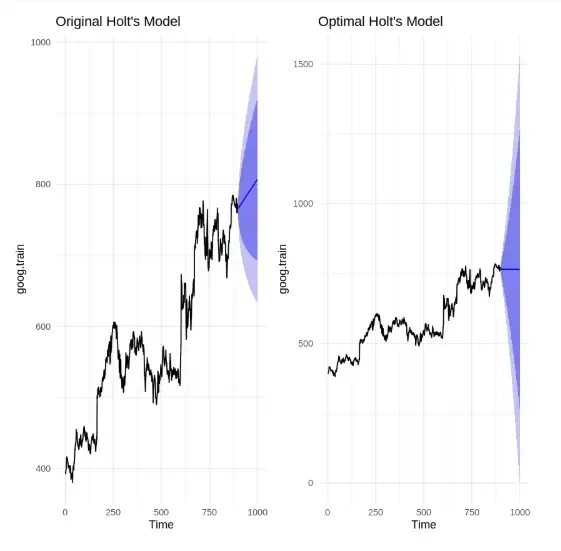
Step 6: Plotting original vs. optimized Holt’s models side by side
We visualize and compare the forecast from the original Holt’s model and the optimized Holt’s model (with tuned beta).
Output:
The comparison shows that the original Holt’s model has a sharper trend and narrower confidence interval, while the optimized model ( = 0.0601) produces a more conservative forecast with a wider confidence band, reflecting dampened trend and increased uncertainty.
The Holt-Winters Seasonal Method is used for time series data that exhibits both trend and seasonality. It extends Holt’s method by including a seasonal component, allowing more accurate forecasting for complex datasets. The method can be applied as Additive for constant seasonal variations or Multiplicative when seasonal effects change proportionally with the series level.
Holt-Winters smoothing uses three parameters:
The method updates these components recursively using the following formulas:
1. Initial level
2. Level update
3. Trend update
4. Seasonal component update
where
Here we implement Holt Winter’s Seasonal Method to forecast time series data that shows both trend and seasonality. The method uses three smoothing parameters: alpha for level, beta for trend and gamma for seasonality and supports both Additive and Multiplicative models depending on the pattern in the data.
Step 1: Installing the required packages
We install the necessary packages for time series analysis and visualization.
Step 2: Loading the required packages
Load the installed packages into the current session. library() loads the specified package.
Step 3: Creating training and testing datasets
Split the qcement dataset into training and test sets to evaluate model performance. window() extracts specific segments from a time series object.
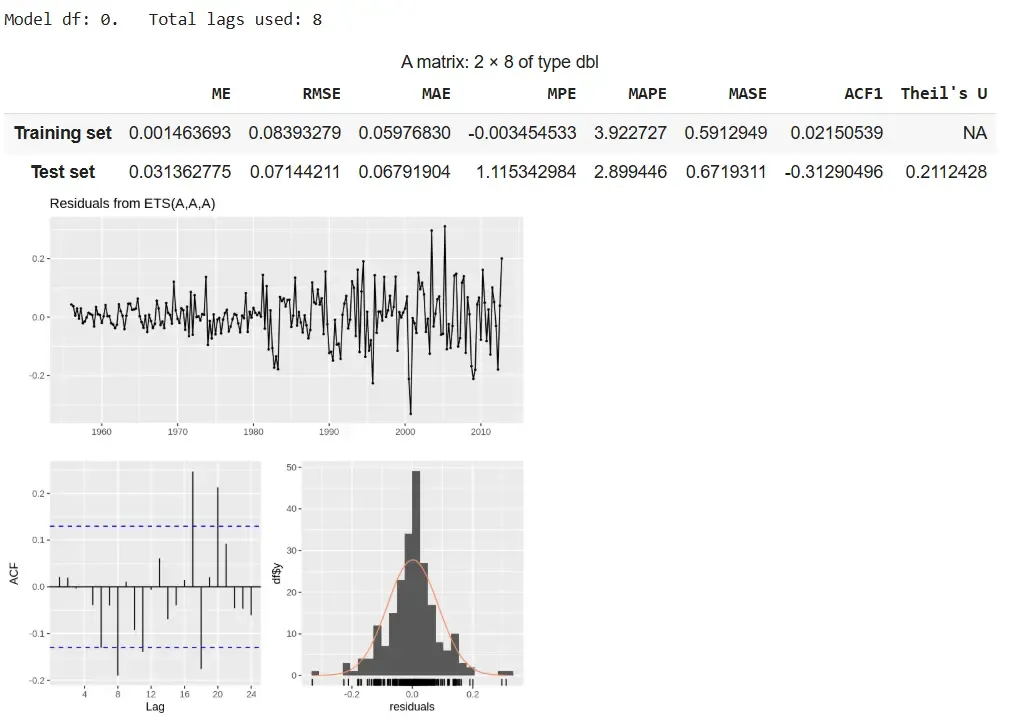
Step 4: Applying the additive Holt-Winters model
We apply the additive seasonal model using ets() with model set to "AAA".
Output:
The additive model delivers accurate forecasts with stable seasonality and low errors, despite slight residual autocorrelation.
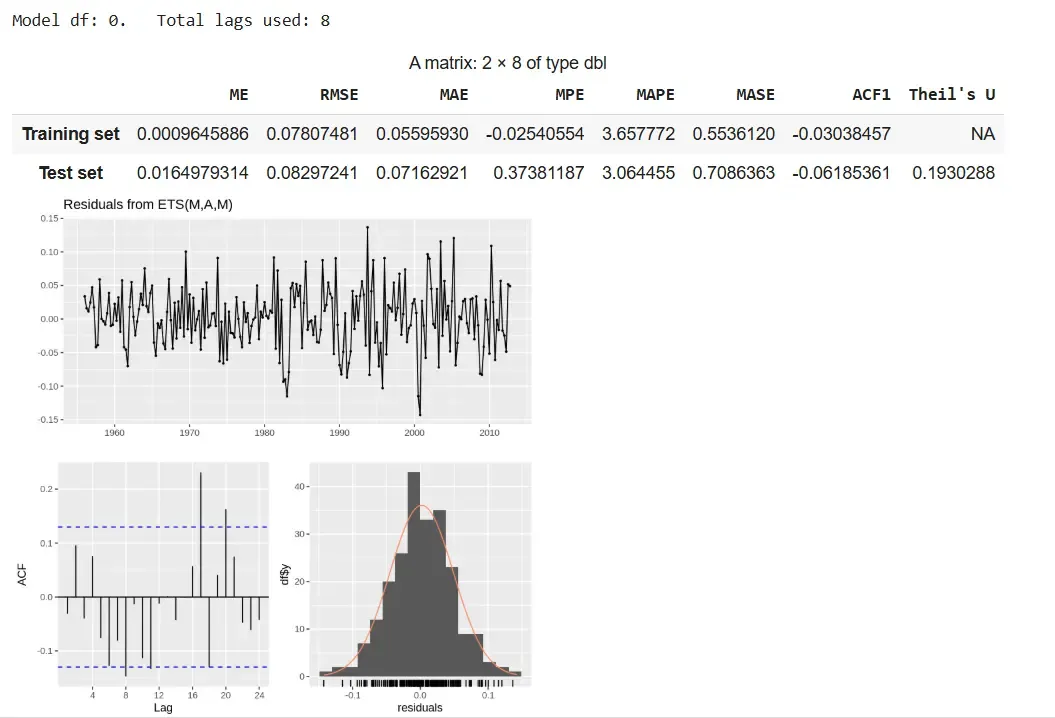
Step 5: Applying the multiplicative Holt-Winters model
We apply the multiplicative model using ets() with model set to "MAM".
Output:
The multiplicative model provides better accuracy with scaling seasonality but shows slight residual autocorrelation.
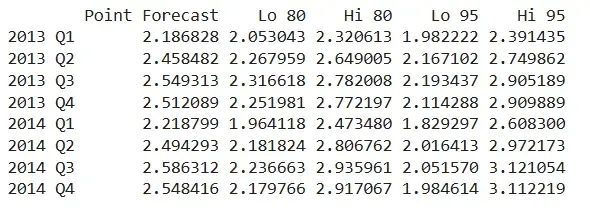
Step 6: Viewing forecasted values
We view the forecast output including the point predictions and confidence intervals for future quarters. qcement.f6 shows predictions for each future period along with 80% and 95% prediction intervals.
Output:
The output displays predicted values for 2013 Q1 to 2014 Q4 using the additive model. The values follow a consistent seasonal trend and highlight the growing uncertainty across periods.
The Damped Trend Method is an extension of Holt’s Exponential Smoothing that is used for time series with a trend, but where the trend is expected to slow down or level off over time. Unlike Holt’s method, which projects the trend indefinitely, the damped trend introduces a damping factor () that reduces the influence of the trend in future forecasts, making long-term predictions more realistic.
This method uses three components:
Step 1: Install and load required packages
Install and load required packages to work with time series data and forecasting functions.
Step 2: Prepare the dataset
Here we use ausbeer dataset as an example, which has a clear trend. We split it into training and test sets for evaluation.
Step 3: Fit the Damped Trend Model
Fit Holt’s method with a damping factor so the trend gradually slows over time.
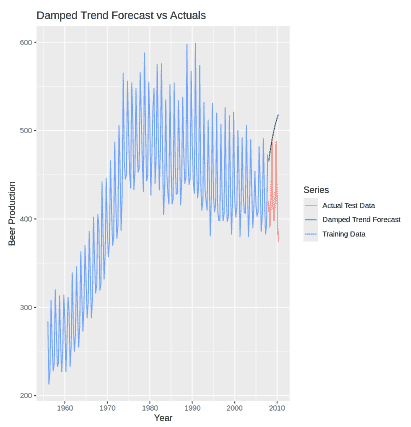
Step 4: Visualize the forecast
Plot the training data, actual test data and the model forecast to see how well the damped trend predicts future values.
Output:
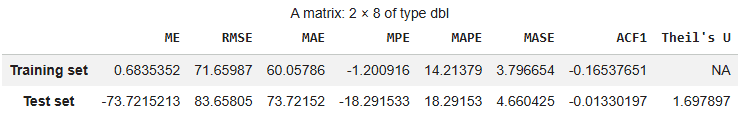
Step 5: Evaluate forecast accuracy
We calculate accuracy metrics like RMSE, MAE and MAPE to check how close the forecast is to the actual test data.
Output:
Download full code from here
Adding a real-world applications section helps readers understand where and why exponential smoothing is used practically: