 |
VOOZH | about |
|
VOOZH | about |
A heat map is a graphical representation of data where each data value is represented in terms of color value. Heatmap is created using heatmap() function in R. Legend associated with histogram makes it easy to understand what the color values mean. Legend is shown with histogram using legend() function in R.
Syntax: heatmap(data)
Parameters:
data: It represent matrix data, such as values of rows and columnsReturn: This function draws a heatmap
Syntax:
legend(x, y, legend, fill, col, bg, lty, cex, title, text.font, bg)Parameters:
x and y: These are co-ordinates to be used to position the legend
legend: Text of the legend
fill: Colors to use for filling the boxes with legend text
col: Colors of lines
bg: It defines background color for the legend box.
title: Legend title (optional)
text.font: An integer specifying the font style of the legend (optional)Returns: Legend plot
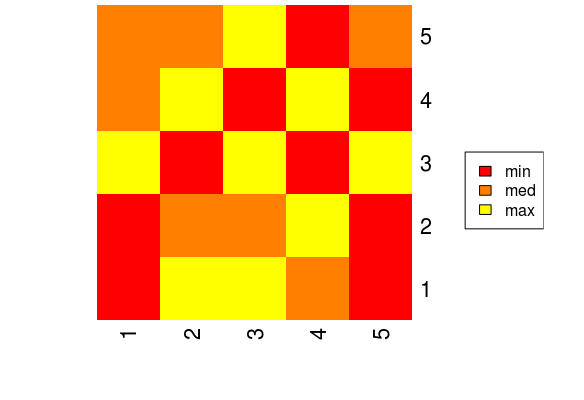
Example 1:
Output:
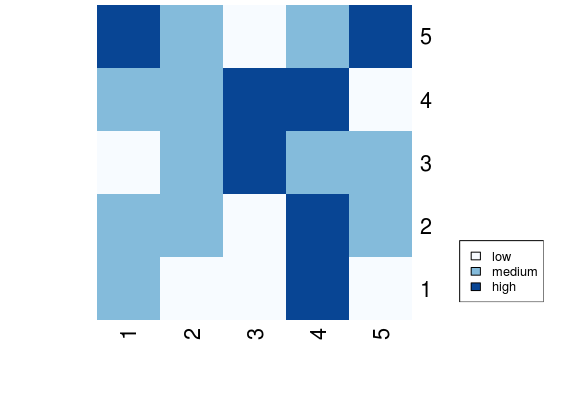
👁 ImageExample 2:
Output:
👁 Image