 |
VOOZH | about |
|
VOOZH | about |
In data visualization, dot plots are effective for displaying distributions of data, especially when dealing with categorical variables and their relationships with numeric values. geom_dotplot() in the ggplot2 package for R allows us to create such plots, providing insights into how variables are distributed across categories. This article explores how to use geom_dotplot() specifically with both fill and group aesthetics in R Programming Language.
A dot plot is a statistical chart that displays data using dots plotted on a simple scale. Each dot represents an observation or data point. Dot plots are useful for visualizing distributions, comparing groups, and identifying patterns or outliers in data.
geom_dotplot() is a function in the ggplot2 package that creates dot plots. It arranges dots horizontally or vertically to represent the frequency or density of observations in each group or category. It supports various aesthetics (aes()) to map data variables to visual properties like position, color, and grouping.
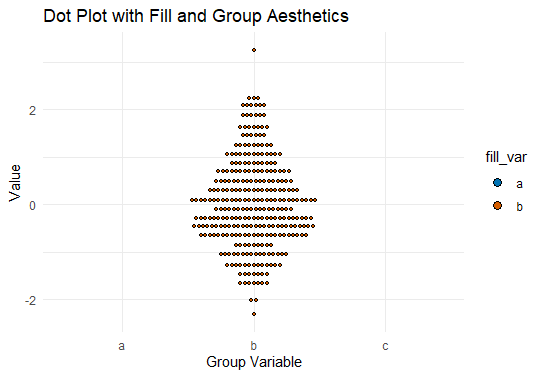
Let's start with a practical example to demonstrate how to use geom_dotplot() with both fill and group aesthetics.
Now we will plot the dot plot using with geom_dotplot().
Output:
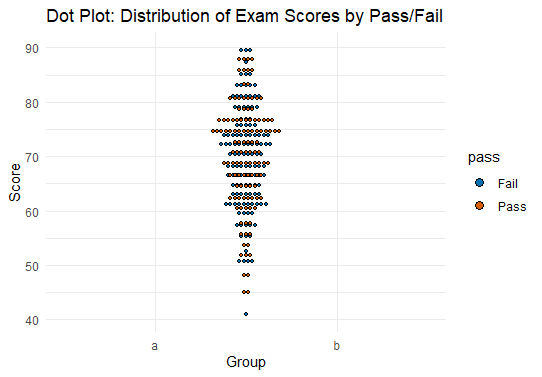
In this example, we visualize the distribution of exam scores (score) across different groups (group) and fill the dots based on pass (pass) or fail status.
Output:
Here are the main Key Concepts and Features of the geom_dotplot().
Using ggplot2 we have multiple Customization Options so lets discuss some of them.
Using geom_dotplot() with both fill and group aesthetics in ggplot2 enhances the visualization of categorical and numeric relationships. By mapping variables to visual properties like color and grouping, you can create informative dot plots that reveal insights into your data. This article has provided a practical guide with examples, covering essential concepts and customization options to effectively use dot plots for data exploration and communication in R. Experiment with different datasets and settings to harness the full potential of geom_dotplot() for your visual analytics needs.