 |
VOOZH | about |
|
VOOZH | about |
A multiple line plot or time series plot shows how values change over time, like crime rates or sales across years. In R, we use the ggplot2 package with the geom_line() function to create these plots. By adding a third variable, we can draw separate lines for different groups, making it easy to compare trends.
Syntax:
ggplot( df, aes( x, y ) ) + geom_line()
Parameters:
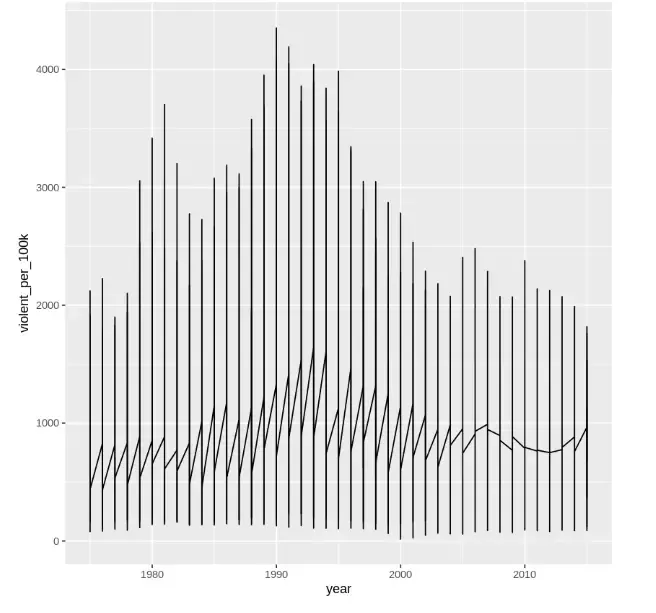
A basic line plot is created to show how violent crime rates (violent_per_100k) changed over the years (year) from 1975 to 2015 using the city crime dataset. Since only two variables are used, it shows a single overall trend line without separating by city or department.
You can download the dataset from here.
Output:
The plot shows the overall trend of violent crime rates per 100,000 people from 1975 to 2015. It displays a single combined line without separating by department, resulting in overlapping vertical lines due to multiple records per year.
To better visualize trends for each department, a grouping variable like department_name should be added.
Syntax:
ggplot( df, aes( x, y, color ) ) + geom_line()
Parameters:
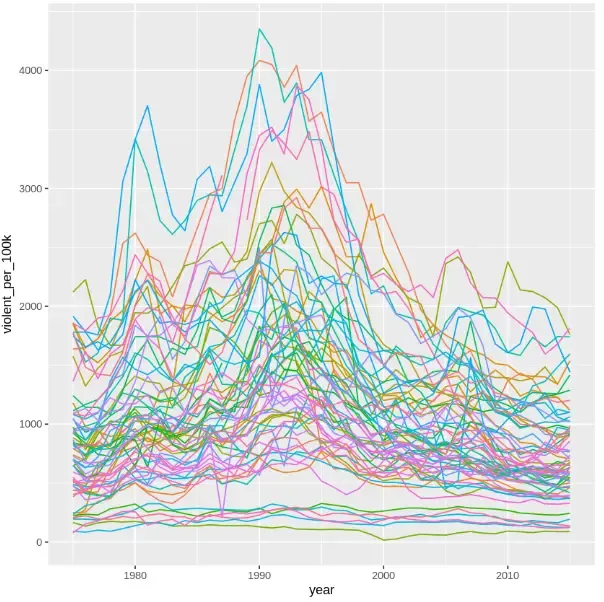
In this example, we create a line plot grouped and colored according to department_name, which separates the data into multiple time series. This allows us to compare the trends of violent crime rates for different departments over the years.
Output:
This plot shows the trends in violent crime rates per 100,000 people over time across multiple departments, with each line representing a different department.
We use multiple line plots to visualize how a numeric variable changes over time across different categories. They are ideal when:
We should avoid them when there are too many groups, as the chart can become cluttered. Filtering or faceting can simplify the visualization in such cases.