 |
VOOZH | about |
|
VOOZH | about |
Multivariate analysis refers to the statistical techniques used to analyze data sets with multiple variables. It helps uncover relationships, reduce complexity and interpret underlying structures in data. These variables can be quantitative or categorical and analyzing them together helps us understanding complex relationships within data.
Some of the multivariate analysis methods in R that are most frequently used are as follows:
Using the built-in iris data set in R, the following example shows how to perform PCA on a data set:
Output:
Importance of components:
PC1 PC2 PC3 PC4
Standard deviation 1.7084 0.9560 0.38309 0.14393
Proportion of Variance 0.7296 0.2285 0.03669 0.00518
Cumulative Proportion 0.7296 0.9581 0.99482 1.00000
The results of the PCA are summarized in this output includes the standard deviation, variance proportion and cumulative proportion for each principal component. The data is efficiently reduced to three dimensions because the cumulative proportion reveals that the first three components account for more than 99% of the overall variance in the data.
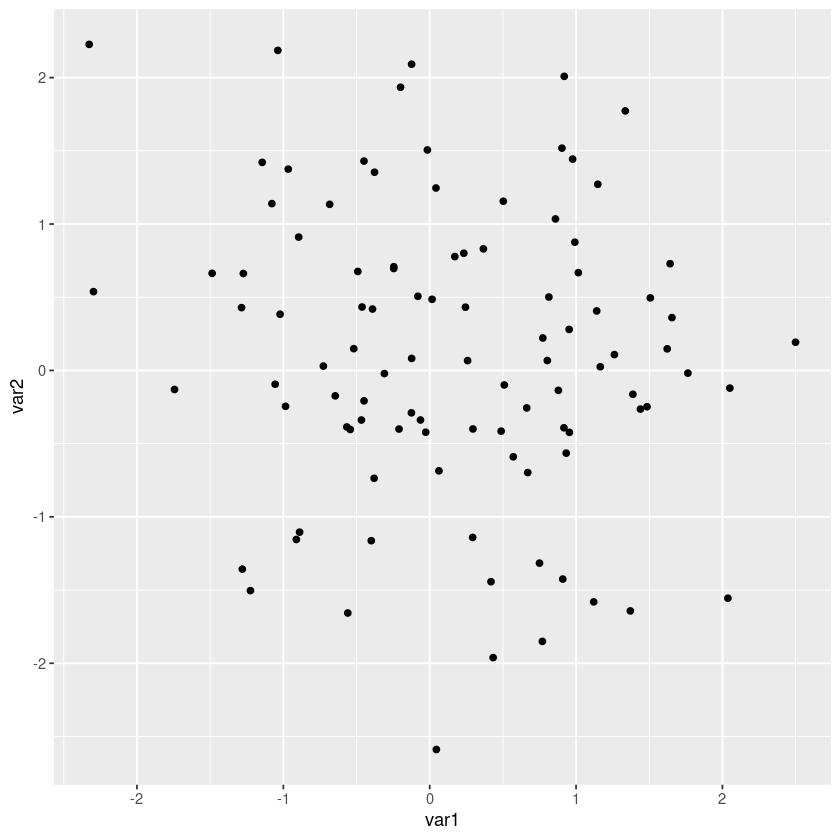
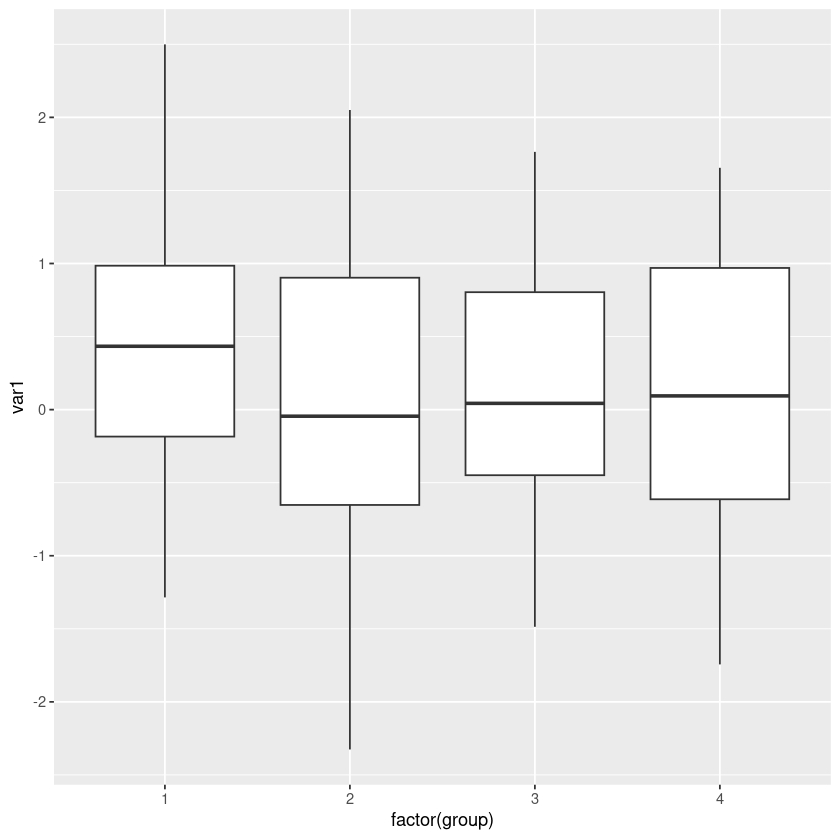
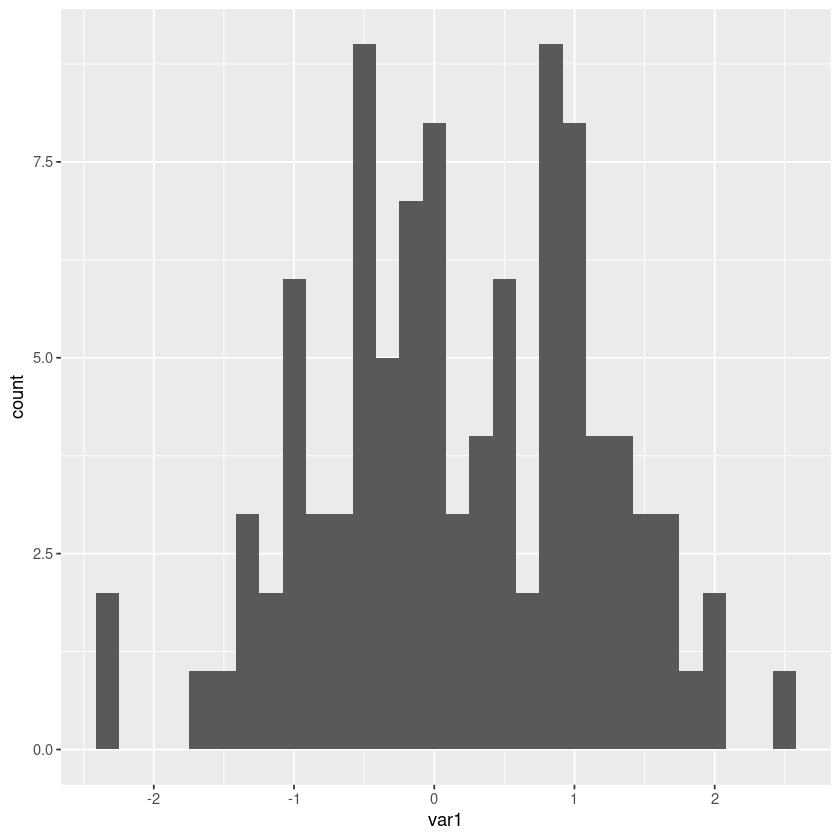
We can better understand the connections between the variables and spot any patterns or trends by visualizing the data. To construct several plot types in R including scatter plots and histograms we can use ggplot2 library.
Output:
Output:
Output:
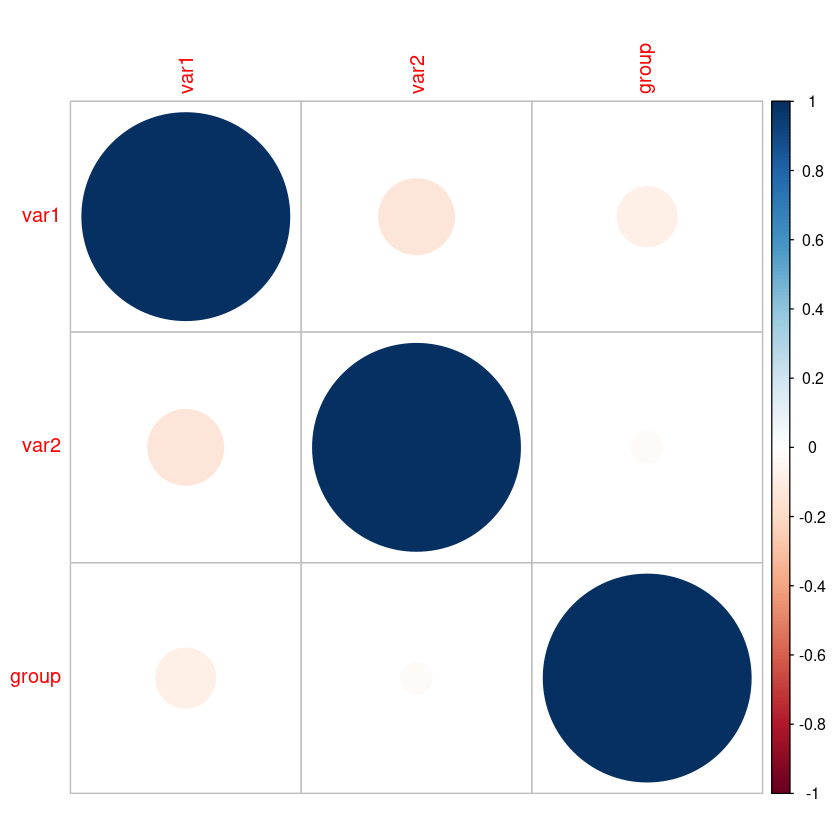
A correlation matrix plot can also be made using the corrplot() method from the corrplot package.
Output:
In multivariate analysis variance, covariance and correlation are crucial measurements because they allow us to understand the connections between the variables. Many functions in R can be used to compute these metrics.
Output:
0.964993019401173
-0.131206113335423
-0.133108806509815
The psych library can also be used to compute various metrics including skewness, kurtosis and factor analysis.
Output:
-0.113671043634579
2.58907790883746
Output:
Factor Analysis using method = minres
Call: fa(r = data)
Standardized loadings (pattern matrix) based upon correlation matrix
MR1 h2 u2 com
var1 1.00 0.9957 0.0043 1
var2 -0.13 0.0171 0.9829 1
group -0.08 0.0062 0.9938 1
MR1
SS loadings 1.02
Proportion Var 0.34
Mean item complexity = 1
Test of the hypothesis that 1 factor is sufficient.
df null model = 3 with the objective function = 0.03 with Chi Square = 2.53
df of the model are 0 and the objective function was 0
The root mean square of the residuals (RMSR) is 0.02
The df corrected root mean square of the residuals is NA
The harmonic n.obs is 100 with the empirical chi square 0.23 with prob < NA
The total n.obs was 100 with Likelihood Chi Square = 0.12 with prob < NA
Tucker Lewis Index of factoring reliability = Inf
Fit based upon off diagonal values = 0.95
Measures of factor score adequacy
MR1
Correlation of (regression) scores with factors 1.00
Multiple R square of scores with factors 1.00
Minimum correlation of possible factor scores 0.99
Two well known methods for multivariate analysis are PCA (Principal Component Analysis) and LDA (Linear Discriminant Analysis). Dimensionality reduction is done with PCA and classification is done with LDA.
Output:
Importance of components:
PC1 PC2 PC3
Standard deviation 1.0946 1.0498 0.9119
Proportion of Variance 0.3826 0.3519 0.2655
Cumulative Proportion 0.3826 0.7345 1.0000
Length Class Mode
prior 4 -none- numeric
counts 4 -none- numeric
means 8 -none- numeric
scaling 4 -none- numeric
lev 4 -none- character
svd 2 -none- numeric
N 1 -none- numeric
call 3 -none- call
terms 3 terms call
xlevels 0 -none- list
With these methods we can do multivariate analysis in R.