 |
VOOZH | about |
|
VOOZH | about |
In this article, we are going to learn the theme in the R system which is used to change the themes of the plot. theme in R is used when one wants to customize the fonts, ticks, and backgrounds of a graph. In R Programming Language the theming system is mainly composed of four components.
Let's discuss the most popular theme-based packages ggthemes, ggdark, hrbrthemes.
Install and load the required packages.
Lets us parse through the most used theme function of ggthemes package as follows.
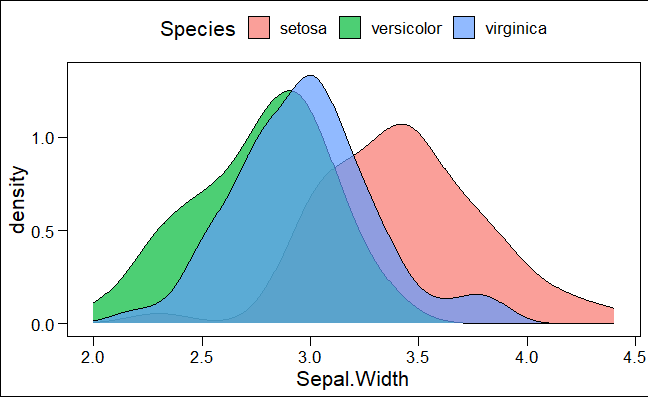
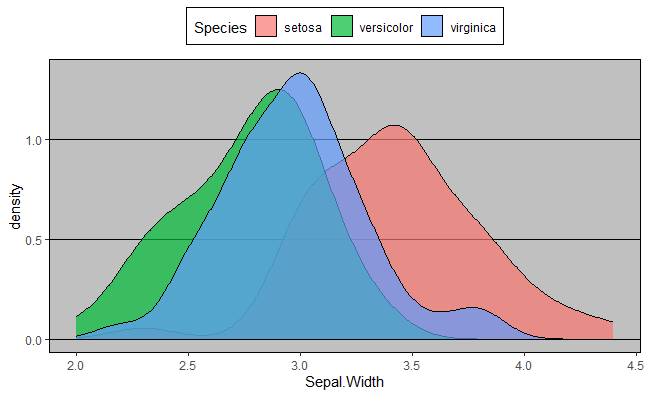
theme_base() – it is similar to the default settings of the ‘base’ R graphics.
Syntax:
theme_base(base_size = 16, base_family = “”)
where,
- base_size – base font size, given in pts.(optional)
- base_family – base font family(optional)
Output:
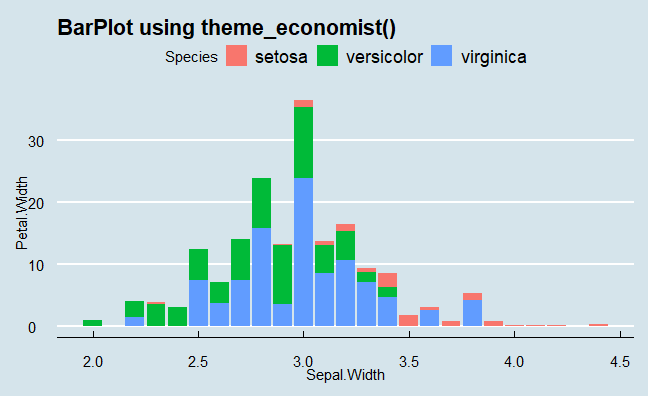
theme_economist(): This theme in R based on the style of plots used by The Economist magazine.
Output:
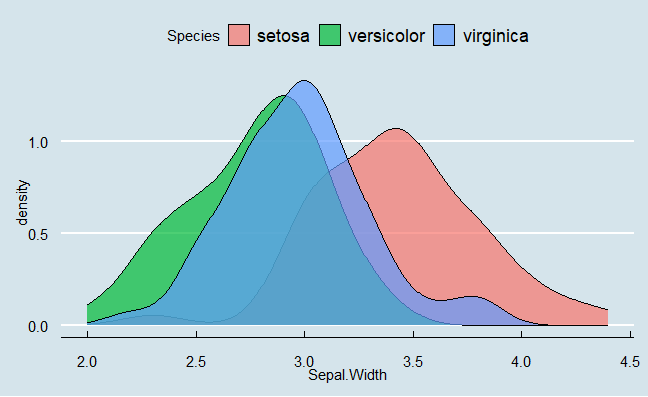
theme_fivethirtyeight(): This theme in R based on the style of plots used by the websites.
Output:
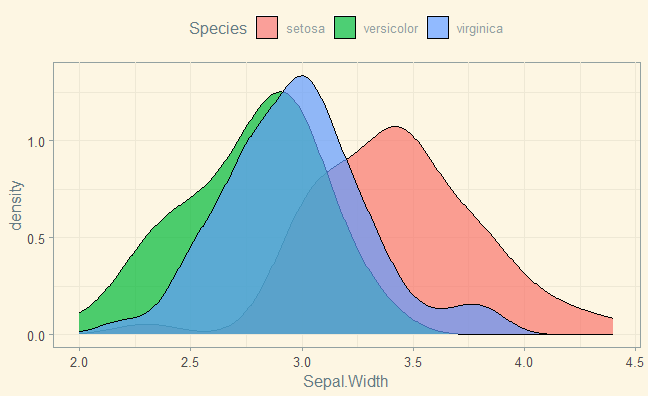
theme_solarized(): This theme in R based on the Solarized color palette.
Output:
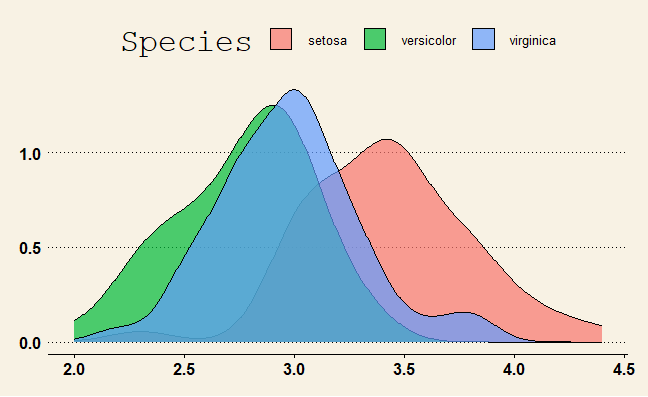
theme_wsj(): This theme in R based on the style of plots used by The Wall Street Journal.
Output:
theme_excel(): This theme in R based on the default color scheme used in Microsoft Excel.
Output:
Output:
Output:
Output:
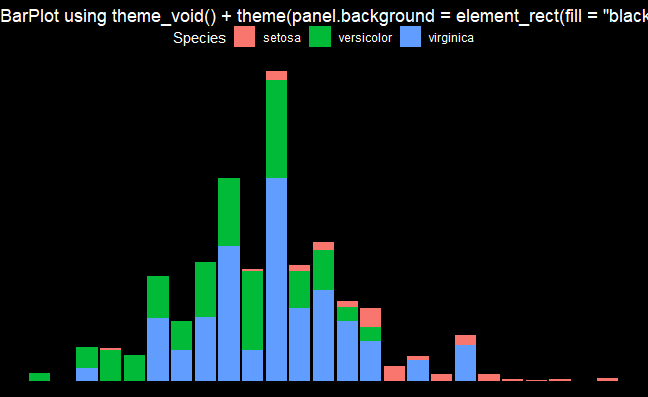
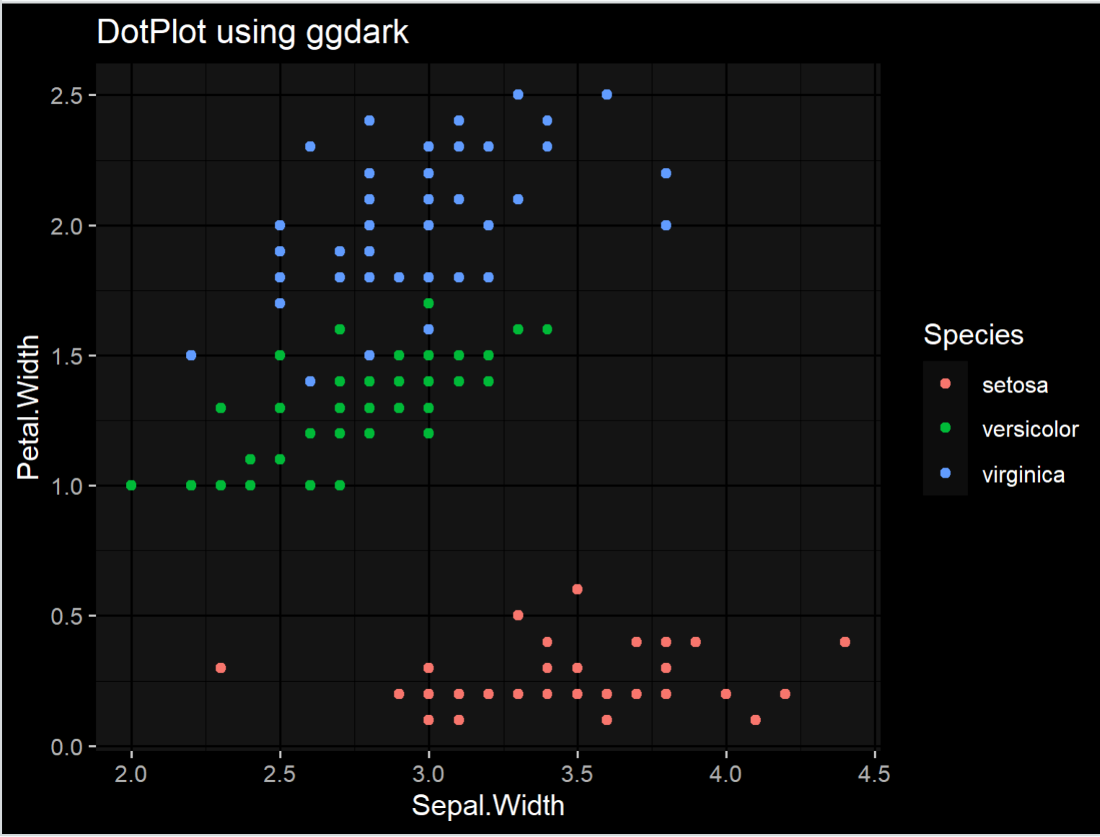
Simply as the name indicates ggdark is a package that is used to produce dark theme-based plots. By applying these functions the colors of the plot are inverted to ensure the plot is visible.dark_mode() is a function present in ggdark package to activate the dark mode.
Syntax:
dark_mode(.theme = theme_get(), verbose = TRUE, force_geom_invert = FALSE)
Where,
- theme - ggplot2 theme object
- verbose - print messages (default: TRUE)
- force_geom_invert - Force the inversion of geom defaults for fill and color/colour (default: FALSE)
Output:
The hrbrthemes package is specifically meant to provide typographic themes which are built on top of the ggplot2 package. There are many functions included in it to produce as follows
Syntax :
theme_ipsum_rc(base_family, base_size, plot_title, axis_title, plot_margin, grid, axis)
Where,
- base_family, base_size - base family and it's font size is specified here
- plot_title - plot title family is specified here
- axis_title - axis title font family, face and size is specified here
- plot_margin - margins of the plot is specified here
- grid - panel grid is specified here
- axis - used to add x or y axes
Output: