 |
VOOZH | about |
|
VOOZH | about |
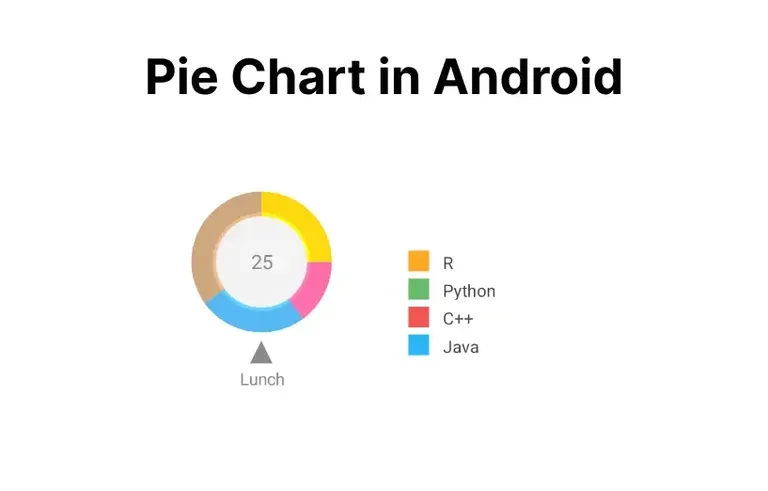
A Pie Chart is a circular statistical graphic, which is divided into slices to illustrate numerical proportions. It depicts a special chart that uses “pie slices”, where each sector shows the relative sizes of data. A circular chart cuts in the form of radii into segments describing relative frequencies or magnitude also known as a circle graph. A pie chart represents numbers in percentages, and the total sum of all segments needs to equal 100%.
Here is the Final Application which will be created.
So let’s see the steps to add a Pie Chart into an Android app.
To create a new project in Android Studio please refer to How to Create/Start a New Project in Android Studio.
Note: Select Java/Kotlin as the programming language.
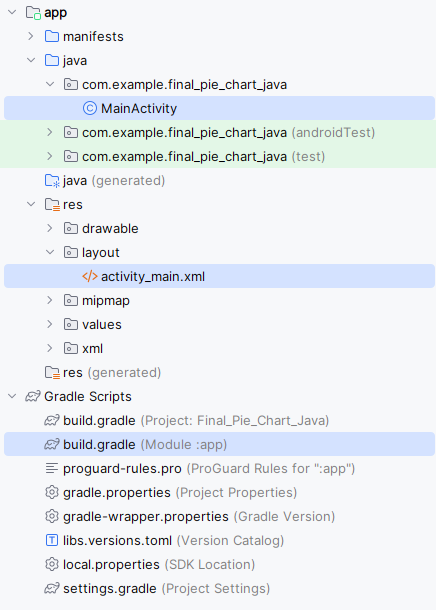
Directory Structure for the Application will seem like this after creation:
i).
Add the dependencies required in the application to implement the Pie Chart.
build.gradle (Module: app):
After Importing following dependencies and click the “sync Now” on the above pop up.
ii).
colors.xml:
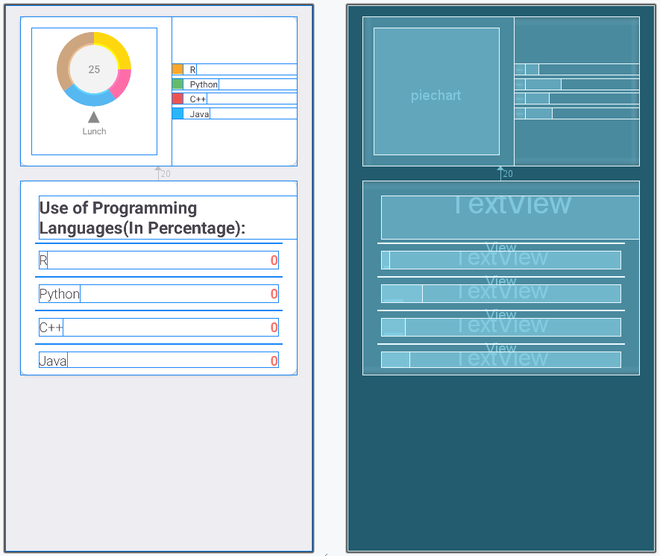
Layout is the component which is essential to define the UI of the application , So let us edit the activity main file.
activity_main.xml:
Now We have created a fine layout implementing the Pie Chart. So, let us add the functionality to this layout and the application by working in MainActivity File.
MainActivity File:
private void setData() method outside onCreate() method and define it.setData() method the most important task is going to happen that is how we set the data in the text file and as well as on the piechart.setData() method set the percentage of language used in their respective text view.addPieSlice() method.startAnimation().setData() method inside onCreate() method.Note : To access the full android application using Pie chat check this repository: Pie Chart Android Application