 |
VOOZH | about |
|
VOOZH | about |
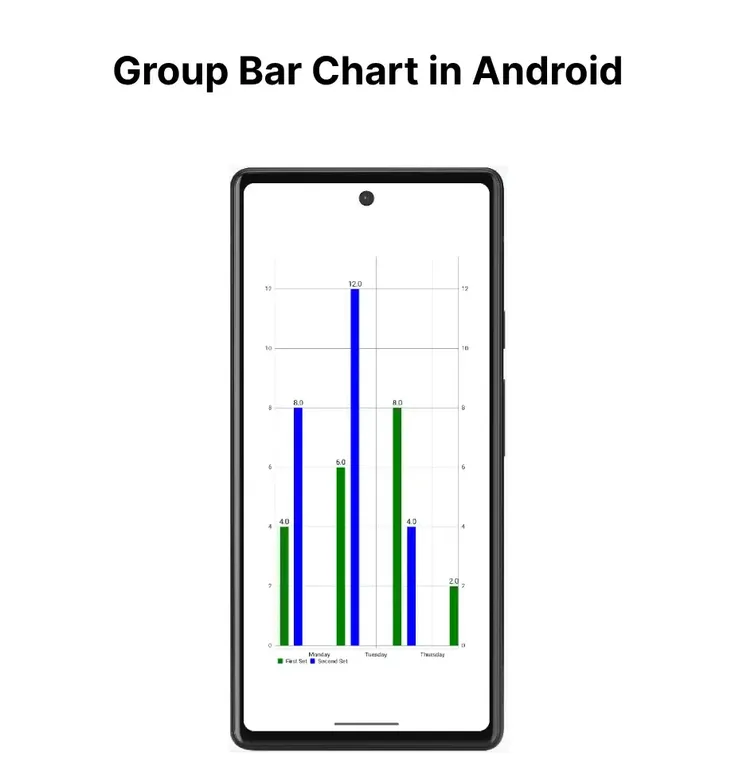
As we have seen how we can create a beautiful bar chart in Android but what if we have to represent data in the form of groups in our bar chart. So that we can plot a group of data in our bar chart. So we will be creating a Group Bar Chart in our Android app in this article.
We will be building a simple application in which we will be displaying a bar chart with multiple sets of data in our Android application. We will display the data in the form of the group in our bar chart. A sample GIF is given below to get an idea about what we are going to do in this article. Note that we are going to implement this project using the Java and Kotlin language.
To create a new project in Android Studio please refer to How to Create/Start a New Project in Android Studio.
Note that select Java/Kotlin as the programming language.
Navigate to the Gradle Scripts > build.gradle(Module:app) and add the below dependency in the dependencies section.
implementation 'com.github.PhilJay:MPAndroidChart:v3.1.0'Add the JitPack repository to your build file. Add it to your root build.gradle at the end of repositories inside the allprojects{ } section.
allprojects{ repositories { ... maven { url "https://jitpack.io/" } }}After adding this dependency sync your project and now we will move towards its implementation.
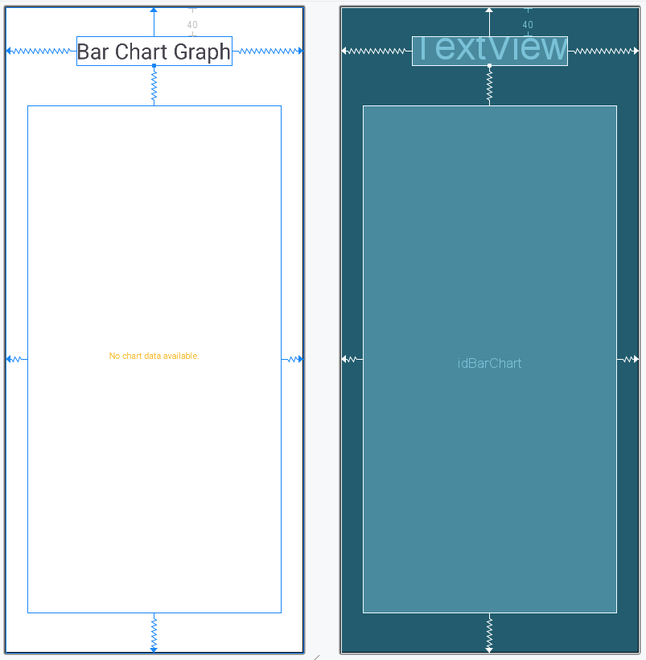
Navigate to the app > res > layout > activity_main.xml and add the below code to that file. Below is the code for the activity_main.xml file.
activity_main.xml:
Go to the MainActivity file and refer to the following code. Below is the code for the MainActivity file. Comments are added inside the code to understand the code in more detail.
MainActivity File:
Now run your app and see the output of the app.
Explanation/Summary of the above Program are mentioned below: