 |
VOOZH | about |
|
VOOZH | about |
Debugging is essential in React Native to identify and fix errors efficiently, ensuring faster and smoother app development. Using Expo CLI simplifies running and debugging applications.
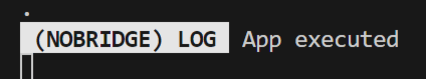
A quick and easy way to debug during development by logging important information using console.log().
Output: We will see the following output on the console.
We can enable Remote Debugging in our application which will enable the React Native code to run in a Chrome browser tab where we can debug it in a manner similar to how we debug web applications using Chrome developer tools.
Debugging in React Native can be done efficiently using Chrome Developer Tools or VS Code with React Native Tools, allowing developers to inspect errors, set breakpoints, and run code step-by-step for faster and precise issue resolution.
Step 1: Run the app
Run the below command on the terminal to execute your app.
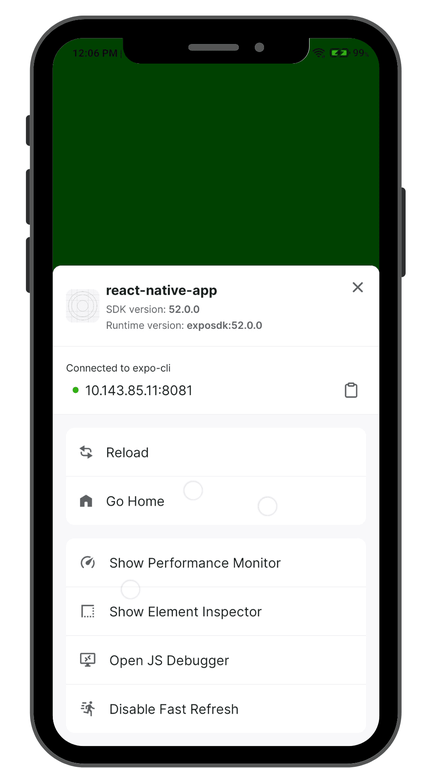
npm start Step 2: Open Developer menu
Once your app has compiled and is running. According to the device that you are using, use the appropriate command:
The developer should look like this.
Step 3: Open JS Debugger
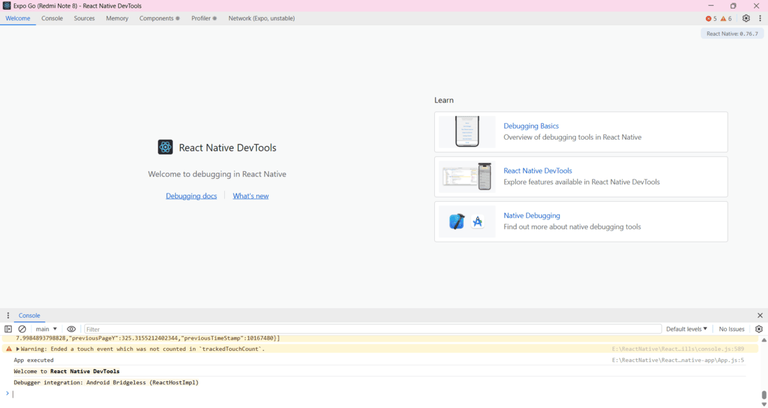
Click on Open JS Debugger to enable remote debugging. This will open a new Expo Go tab in your PC as mentioned in below image.
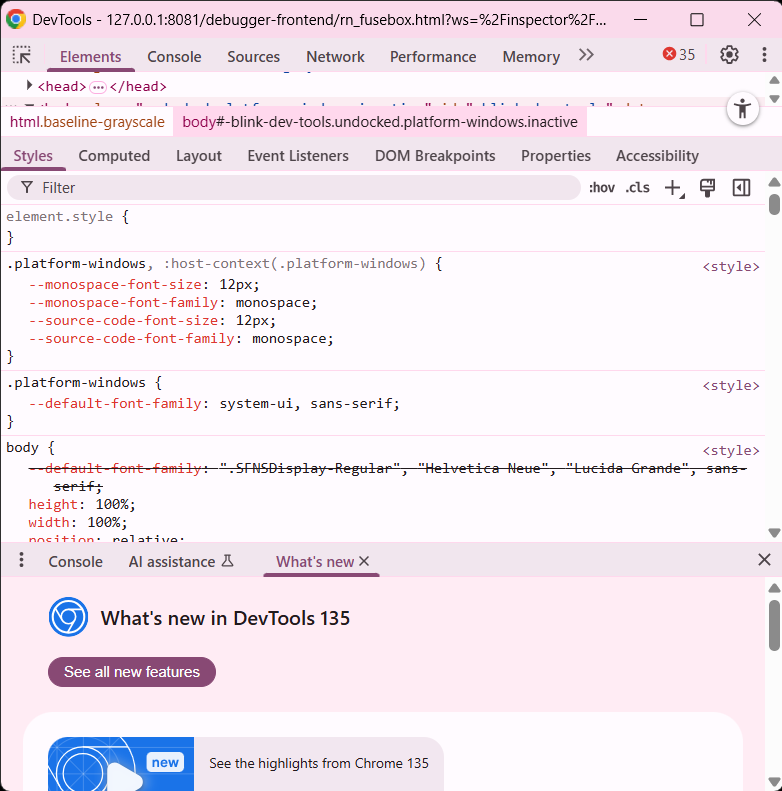
Step 4: OpenChrome developer tools
Now, press Ctrl+Shift+I to open the Chrome developer tools. The navigation panel will look like this:
Here in the Console tab we can view the errors in our applications as well as the logs created by our application. In the Sources tab, we should enable caught exceptions in order to identify the line on which the error occurred. Additionally, we can do a line-by-line run of the code and step into functions for a more detailed view of the program execution.
👁 ImageOnce we are done with our debugging session, we should turn off remote debugging by clicking on the Stop Remote Debugging option in the developer tools of your app. This will prevent your app from being slow, as Remote Debugging significantly reduces the speed of the application.
VS Code’s React Native Tools extension allows easy debugging of React Native apps with proper configuration.
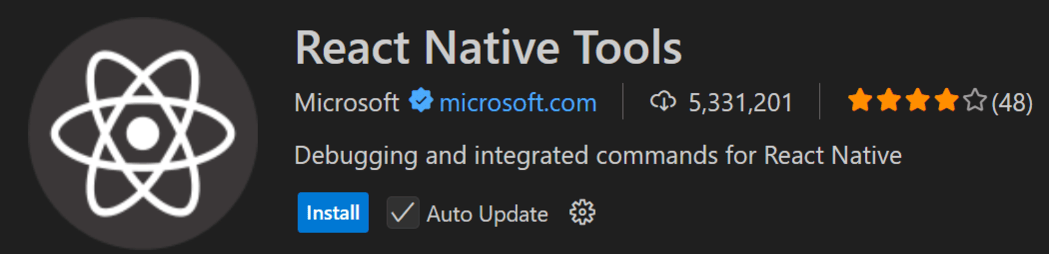
Step 1: Install Extensions
Install the VS Code Extensions mentioned below.
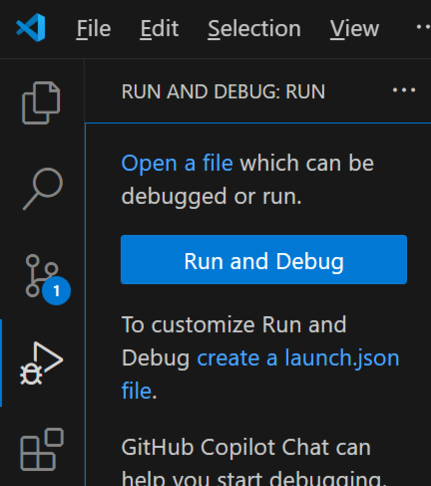
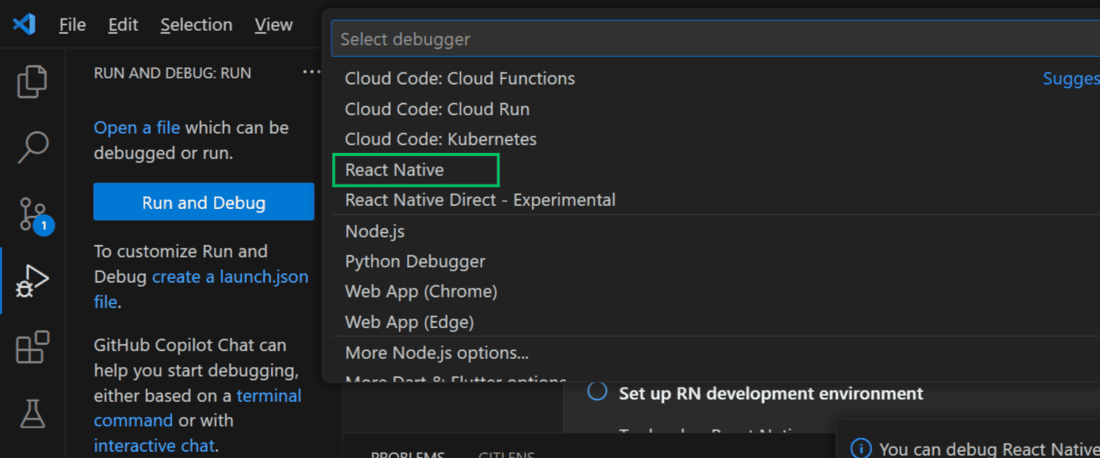
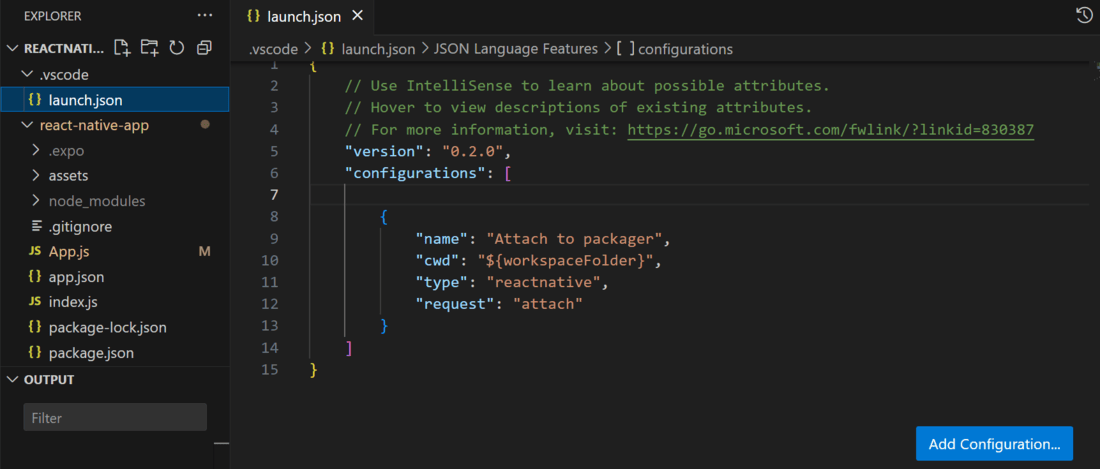
Step 2: Create a launch.json file
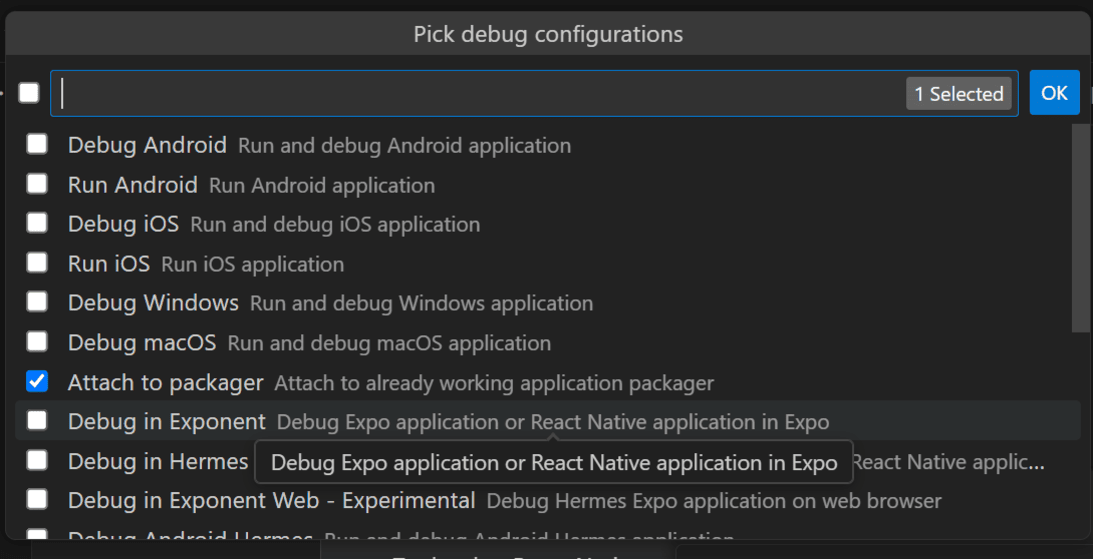
Step 3: Activate Attach to Packager
Run the App and go to "Run and Debug" section in VS code and click on "Attach to packager" as mentioned in below image.
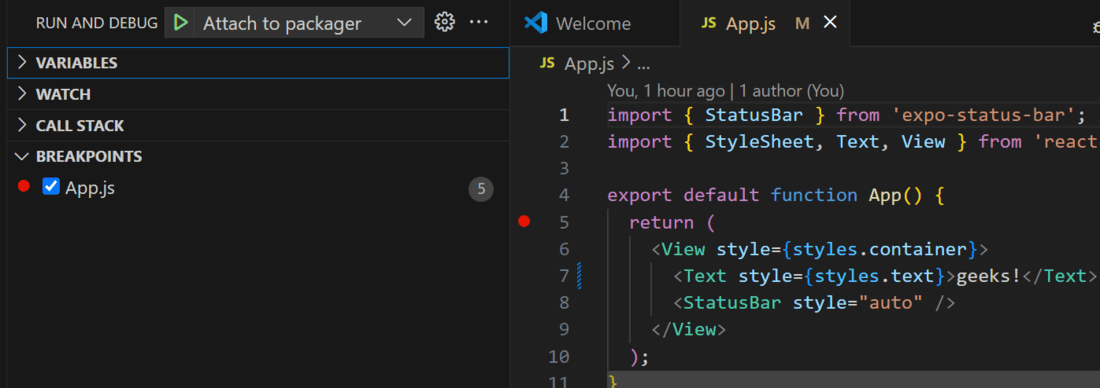
Step 4: Break Points
Open the App.js file and click to the left of any line containing logic. This will display a red dot and open the Run and Debugger section in Visual Studio Code. All breakpoints will be shown there, as illustrated in the image below.
Then, when the code is executed, all debug logs will display in the DEBUG CONSOLE.